Air quality trends and lessons learnt in India during the COVID lockdowns
Sarath K. Guttikunda and Nishadh K.A.
CCAPC/2020/03 | August 2020 | Edited by Santosh Harish | Posted: August 21 2020
The authors are affiliated with http://www.urbanemissions.info, a knowledge partner of the Collaborative Clean Air Policy Centre.
Suggested citation: Guttikunda, S.K,, Nishadh, K.A., 2020. Air quality trends and lessons learnt in India during the COVID lockdowns. Policy Brief, CCAPC/2020/03, Collaborative Clean Air Policy Centre, New Delhi
CCAPC joins the global public health and scientific community in mourning the loss of Professor Kirk R. Smith, an exemplary researcher, colleague, mentor, friend and, most of all, an iconic champion of clean air for everyone, especially the poor. Prof. Smith worked tirelessly to highlight the widespread health impacts of air pollution and explore ways to reduce them. We are deeply saddened by his sudden and unexpected death on June 15, 2020, at his home in Berkeley. Dr. Smith, Professor of Global Environmental Health at University of California, Berkeley’s School of Public Health, was the founding director of CCAPC. Read our tribute to him here.
Abstract
In this paper, we document the changes observed in ambient air quality during this lockdown periods (March-May 2020) and reflect on what these mean for air quality management in India. Four lockdown periods were observed between March and May 2020, that entailed restrictions on all activities (more below) except for a few notified essential services. Across Indian cities, a 20%-60% reduction was witnessed in all the lockdown periods for PM2.5, PM10, SO2, and NO2 and 10%-60% increase in daytime O3 concentrations. Building on the Air Pollution knowledge and Analysis (APnA) database, we also outline notable city-specific trends and reflect on the lessons they provide for air quality management in India. These reductions demonstrated to the public that the only way to achieve “clean air” is by cutting emissions at the source, albeit not at the social and economic costs observed during the lockdown; other more sustainable, well-proven approaches exist. Air quality changes observed during the lockdown also show that we must adopt an airshed approach where the reductions in the city are complemented with similar reductions in the region to reach and sustain the national ambient standards.
1. Introduction
As of 2019, 21 of the 30 cities with the worst PM2.5 pollution levels globally were in India with five cities in the top 10 in the national capital region of Delhi (IQair, 2019). At the country level, India was ranked fifth, behind Bangladesh, Pakistan, Mongolia, and Afghanistan for the worst air quality in the world.
Data available from the official and unofficial monitoring networks, and global simulations coupled with satellite observations establish a worsening trend for India’s air quality levels over the last two decades (Van Donkelaar et al., 2016; van Donkelaar et al., 2019). In 2018, on an annual basis, 40% of the districts did not meet the national ambient standard (40 microgram/m3) and 98% of the districts did not meet the World Health Organization guideline (10 microgram/m3).
This trend is also evident from the estimated health impacts (Balakrishnan et al., 2019; GBD, 2019). In India, 280,000 premature deaths were associated with ambient PM2.5 pollution in 1990 (ranked 15); by 2017, this had increased to 680,000 (ranked 4), behind only blood pressure, diabetes, and smoking as a a risk factor.
Can we reverse this trend? The National Clean Air Programme (NCAP) was formally launched in January 2019 and categorized 122 cities in 20 states and three union territories as “non-attainment”. The programme is designed to document the following in these cities:
emission and pollution load via monitoring and modelling
activities necessary for all the known sources to achieve 20-30% reduction in the ambient PM2.5 levels by 2024, when compared to 2017
plans to build institutional capacity to manage the information flow and
ways to oversee the progress on various components of the programme.
These commitments have no legal binding, and NCAP therefore raises many questions on accountability (Ganguly et al., 2020; WIRE, 2018).
All this was before the unprecedented times of COVID19 infections, lockdowns, and associated slowdown in the economy. In this paper, we document the changes observed in ambient air quality during this lockdown periods (March-May 2020) and reflect on what these mean for air quality management in India. In interpreting the changes in air quality levels, we draw on previous work on understanding source contributions in cities across the country (Chowdhury et al., 2019; CPCB, 2011; GBD-MAPS, 2018; Goel and Guttikunda, 2015; Guttikunda and Gurjar, 2012; Guttikunda et al., 2015; Guttikunda and Goel, 2013; Guttikunda et al., 2014; Guttikunda and Jawahar, 2012; Guttikunda and Mohan, 2014; Guttikunda et al., 2019; Pandey et al., 2014; Sadavarte and Venkataraman, 2014; Venkataraman et al., 2018; Venkataraman et al., 2016).
2. Data and methods
2.1 Continuous ambient air quality data
We accessed the air quality data from the official network operated and maintained by the Central Pollution Control Board (CPCB) (CPCB, 2020). As of May 2020, there are 230 continuous ambient air quality monitoring stations (CAAQMS) operating in 124 of the 640 districts listed in Census 2011 (see Table 1).The number of monitors varies greatly by city: Delhi has 38 operational monitors, but most other cities have only one monitor. While this may not be a representative sample for most of the cities, we use this information to understand the temporal trends because this is the only source of ambient air quality information in India to date. To spatially and temporally represent air quality in India, at least 4000 continuous air monitors are required – 2,800 in the urban areas and 1,200 in the rural areas (Brauer et al., 2019; Pant et al., 2019; WIRE, 2017).

Air quality data are available for 2 PM size bins (PM2.5 and PM10), sulphur dioxide (SO2), nitrogen dioxide (NO2), carbon monoxide (CO), and ozone.
2.2 COVID19 lockdowns
Four lockdown periods were observed between March and May 2020, that entailed restrictions on all activities (more below) except for a few notified essential services.
Lockdown Phase 1: March 24- April 14, 2020 (21 days)
Lockdown Phase 2: April 15- May 3, 2020 (19 days)
Lockdown Phase 3: May 4- May 17, 2020 (14 days)
Lockdown Phase 4: May 18- May 31, 2020 (14 days)
From June 1, 2020, individual states started to ease the restrictions in phases and some states also imposed partial lockdowns depending on the community infection rates. In this study, we analyze the ambient air quality data for 5 time periods (a) 30 days before the first lockdown and (b) four lockdown periods.
Lockdown periods featured the following regulations across the country
Offices implemented work-from-home, and schools, colleges, universities, training institutions, markets, malls, religious centres, and other public spaces were closed.
All shops and small-scale industries in the urban and rural areas were shut - with exceptions introduced after for essential food and medicine supply chains. Together with 1 above, these reduced most of the demand for commuter movement on the roads.
Construction activities were stopped including brick manufacturing. This reduced the dust loading in the hotspots, debris movement, and construction freight movement.
Reporting of open waste burning activities reduced. However, there is no indication of reduced open waste burning activities at the community level. Waste management activities stopped at the beginning at the lockdowns and gradually reopened.
Passenger and public transport movement was stopped, with exceptions for police, press, and medicine practitioners and some with special permissions on an as-needed basis.
All freight movement was initially stopped on the highways and at the interstate border crossing. However, this was eased after the first week in response to supply shortages in the cities, mostly for essential goods
Heavy industries (like power plants, refineries, fertilizers, cement, iron and steel, and other ore processing units) limited their operational times and fuel consumption loads, in response to the lower demand.
Resuspension of road dust was likely to be at a minimum with reduced traffic on the roads.
As the lockdown periods were extended, air quality visibly improved across the country. Below are some instances posted online from various cities.
Figure 1: Images of visibly cleaner skies posted online from various cities - SaalBhar60 (year-round 60) campaign by Clean Air Collective
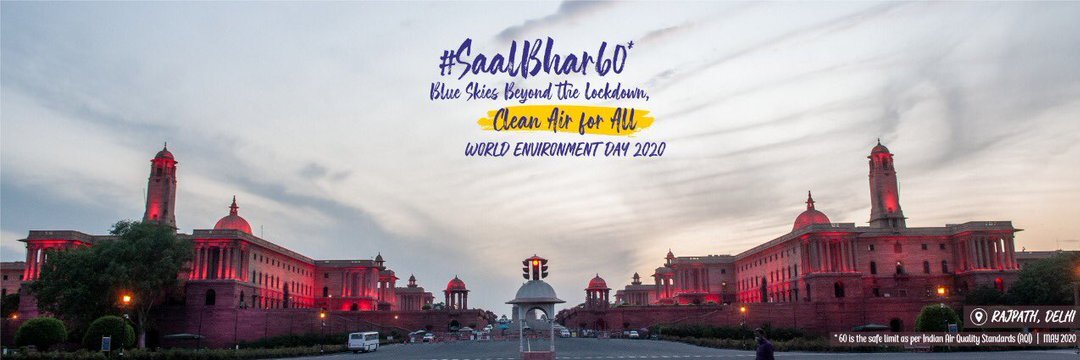


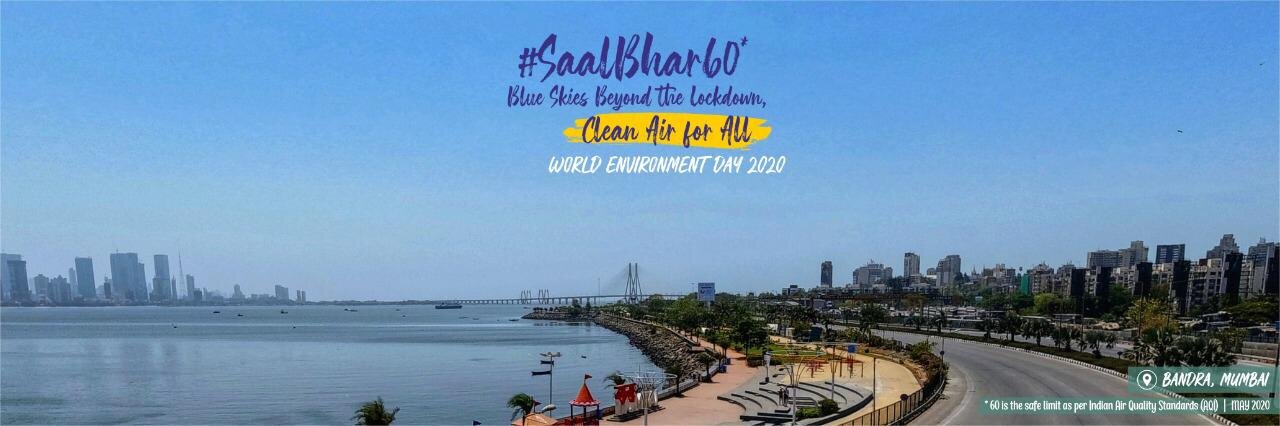
Figure 2: A viral photograph of the Himalayan range being visible from Punjab, 200 km away (Source: https://twitter.com/anshulchopraa)

3. Changes in air quality levels during the lockdowns
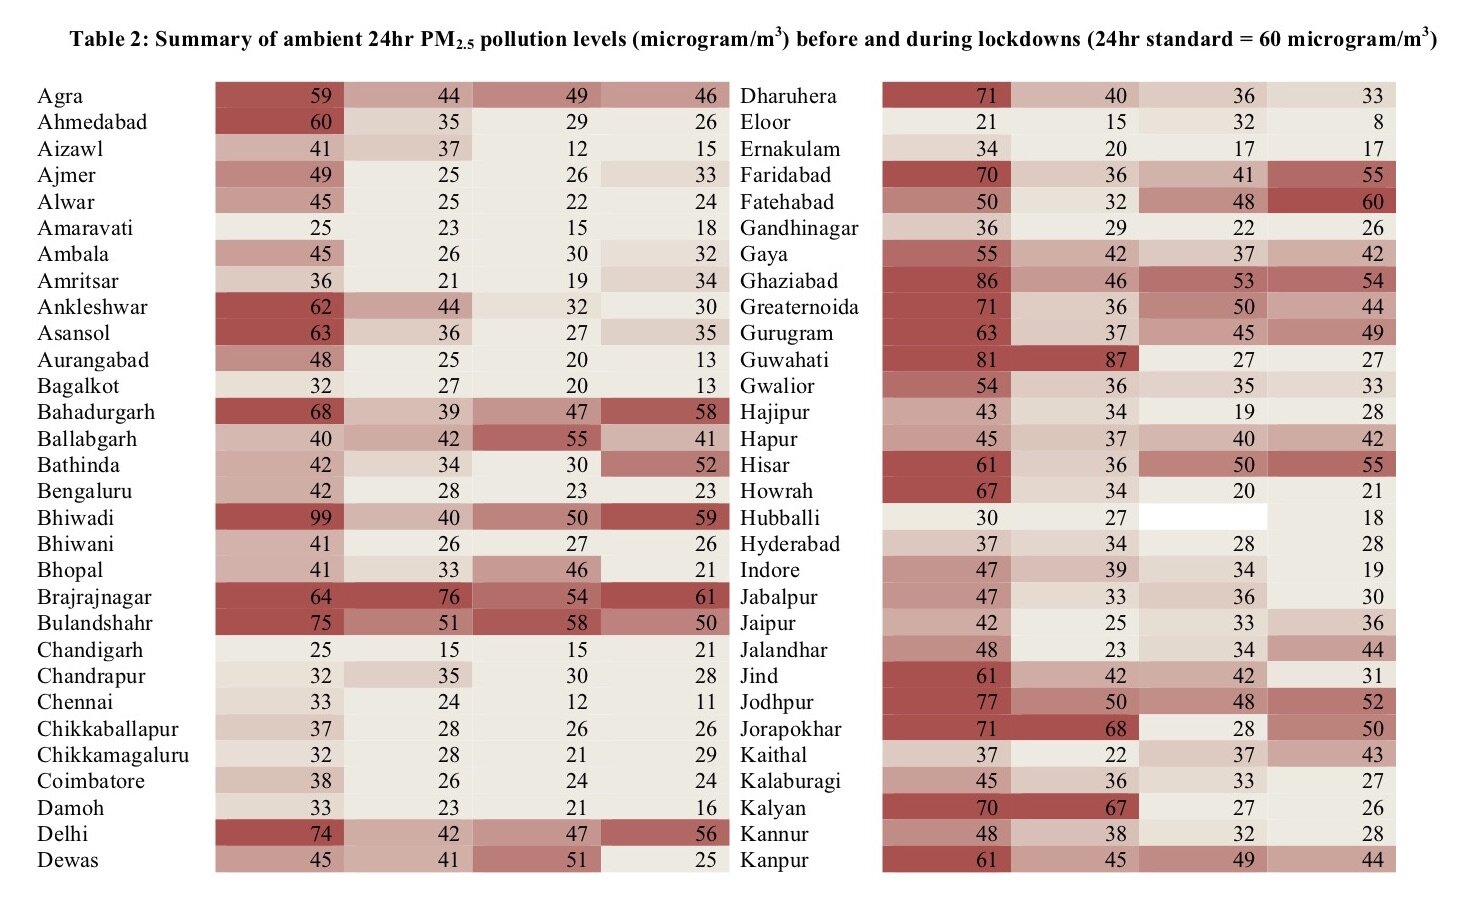
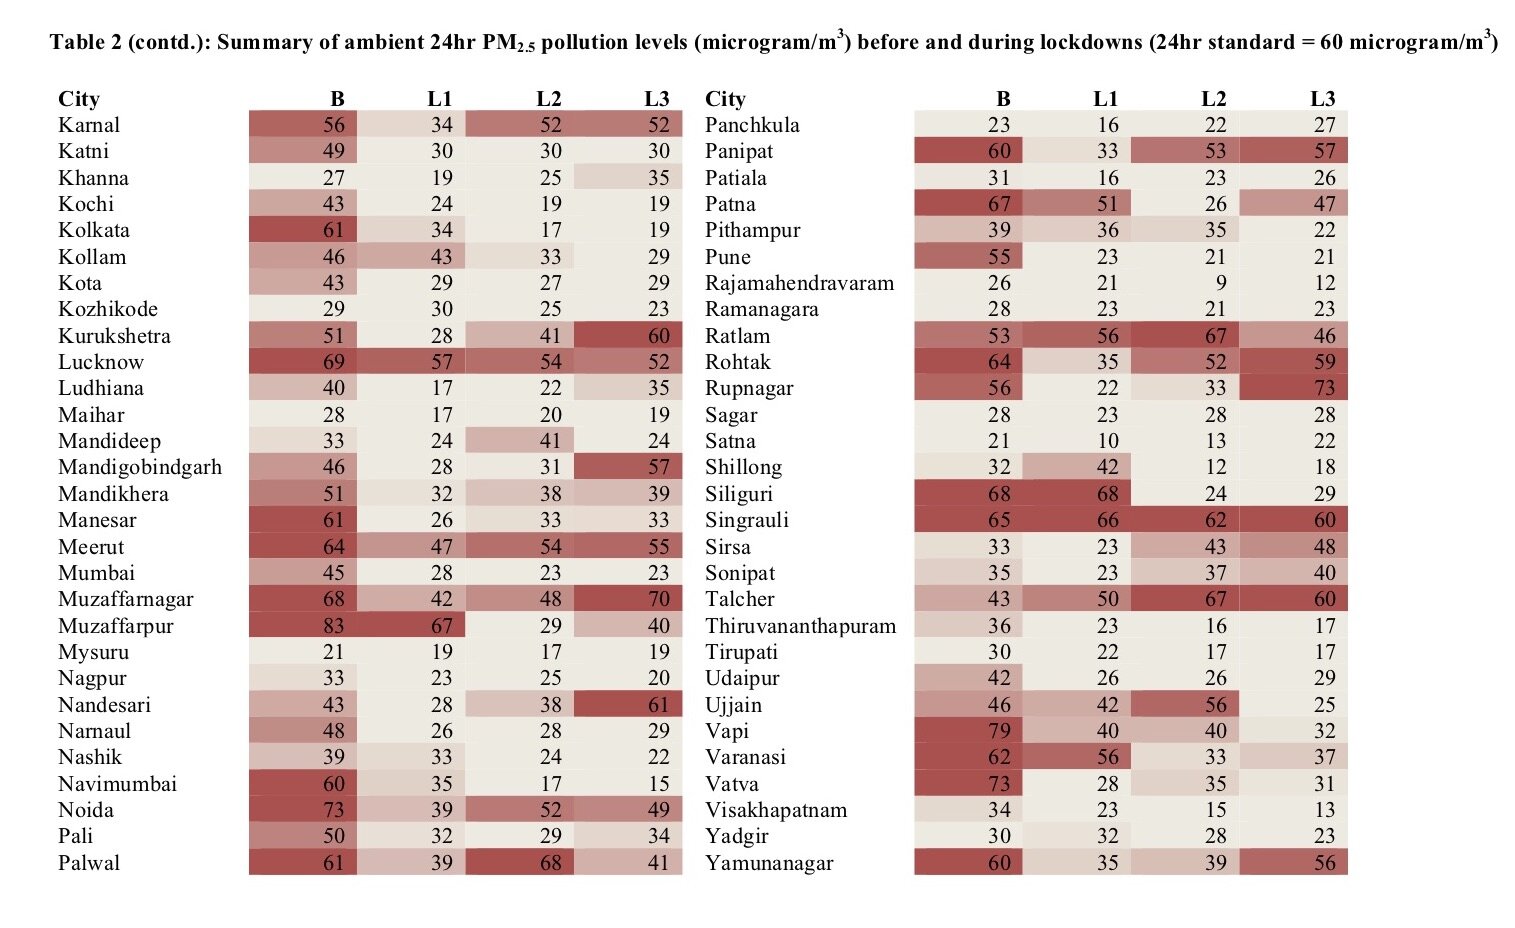
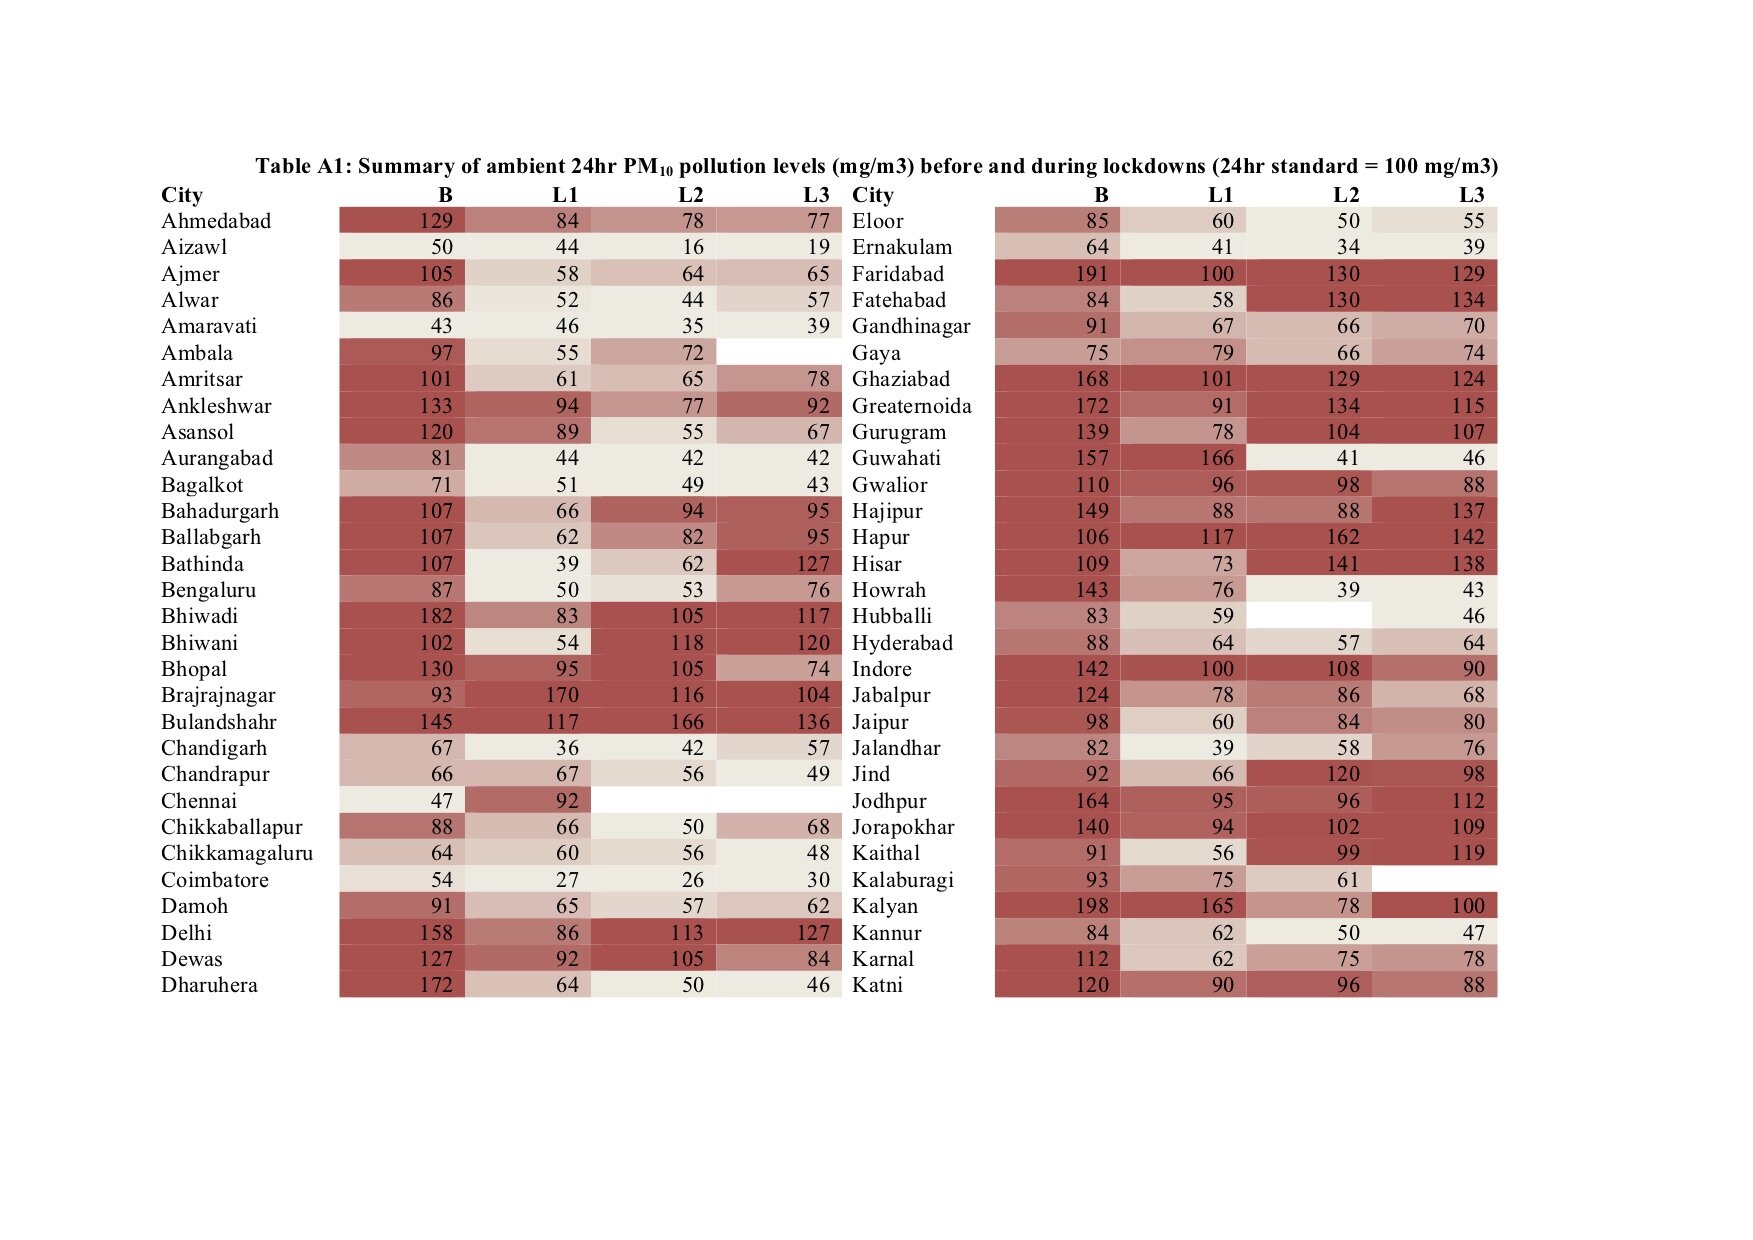
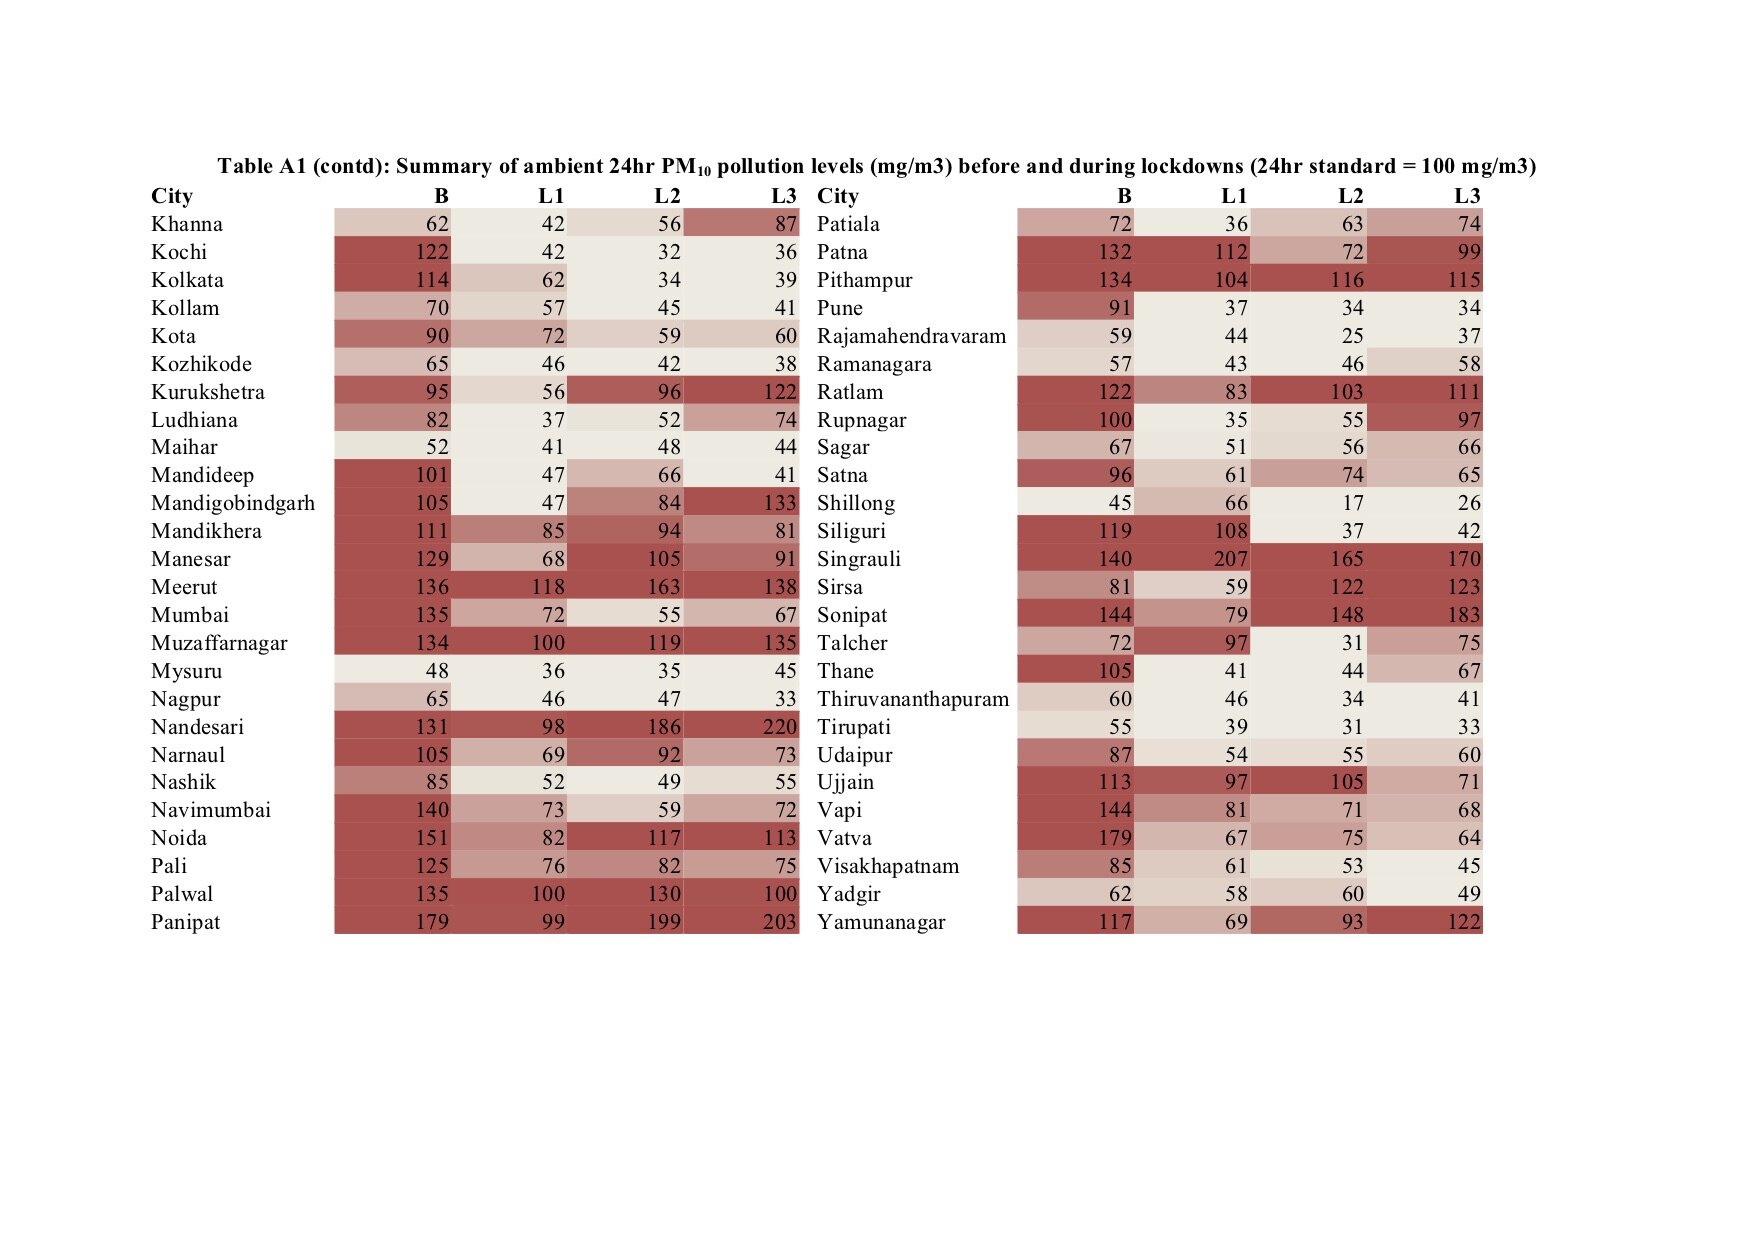
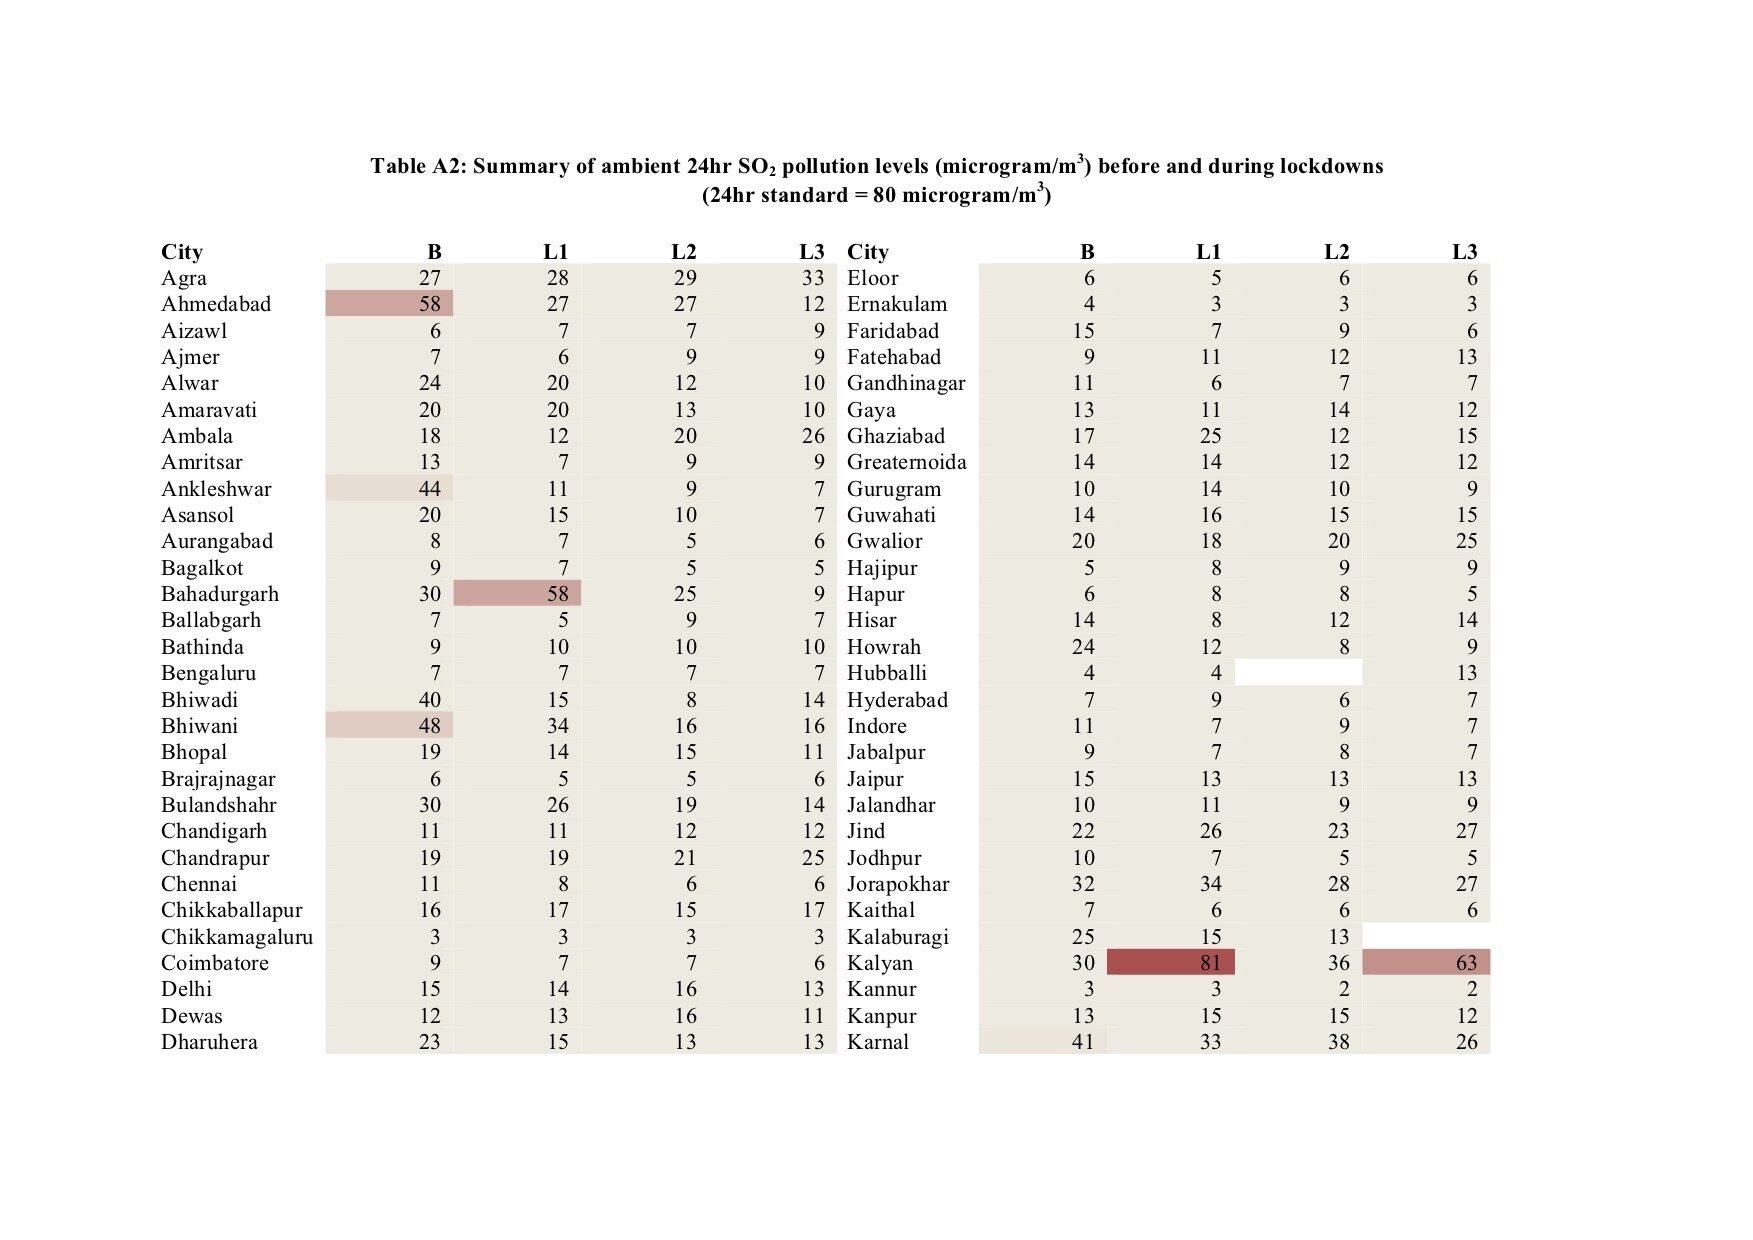
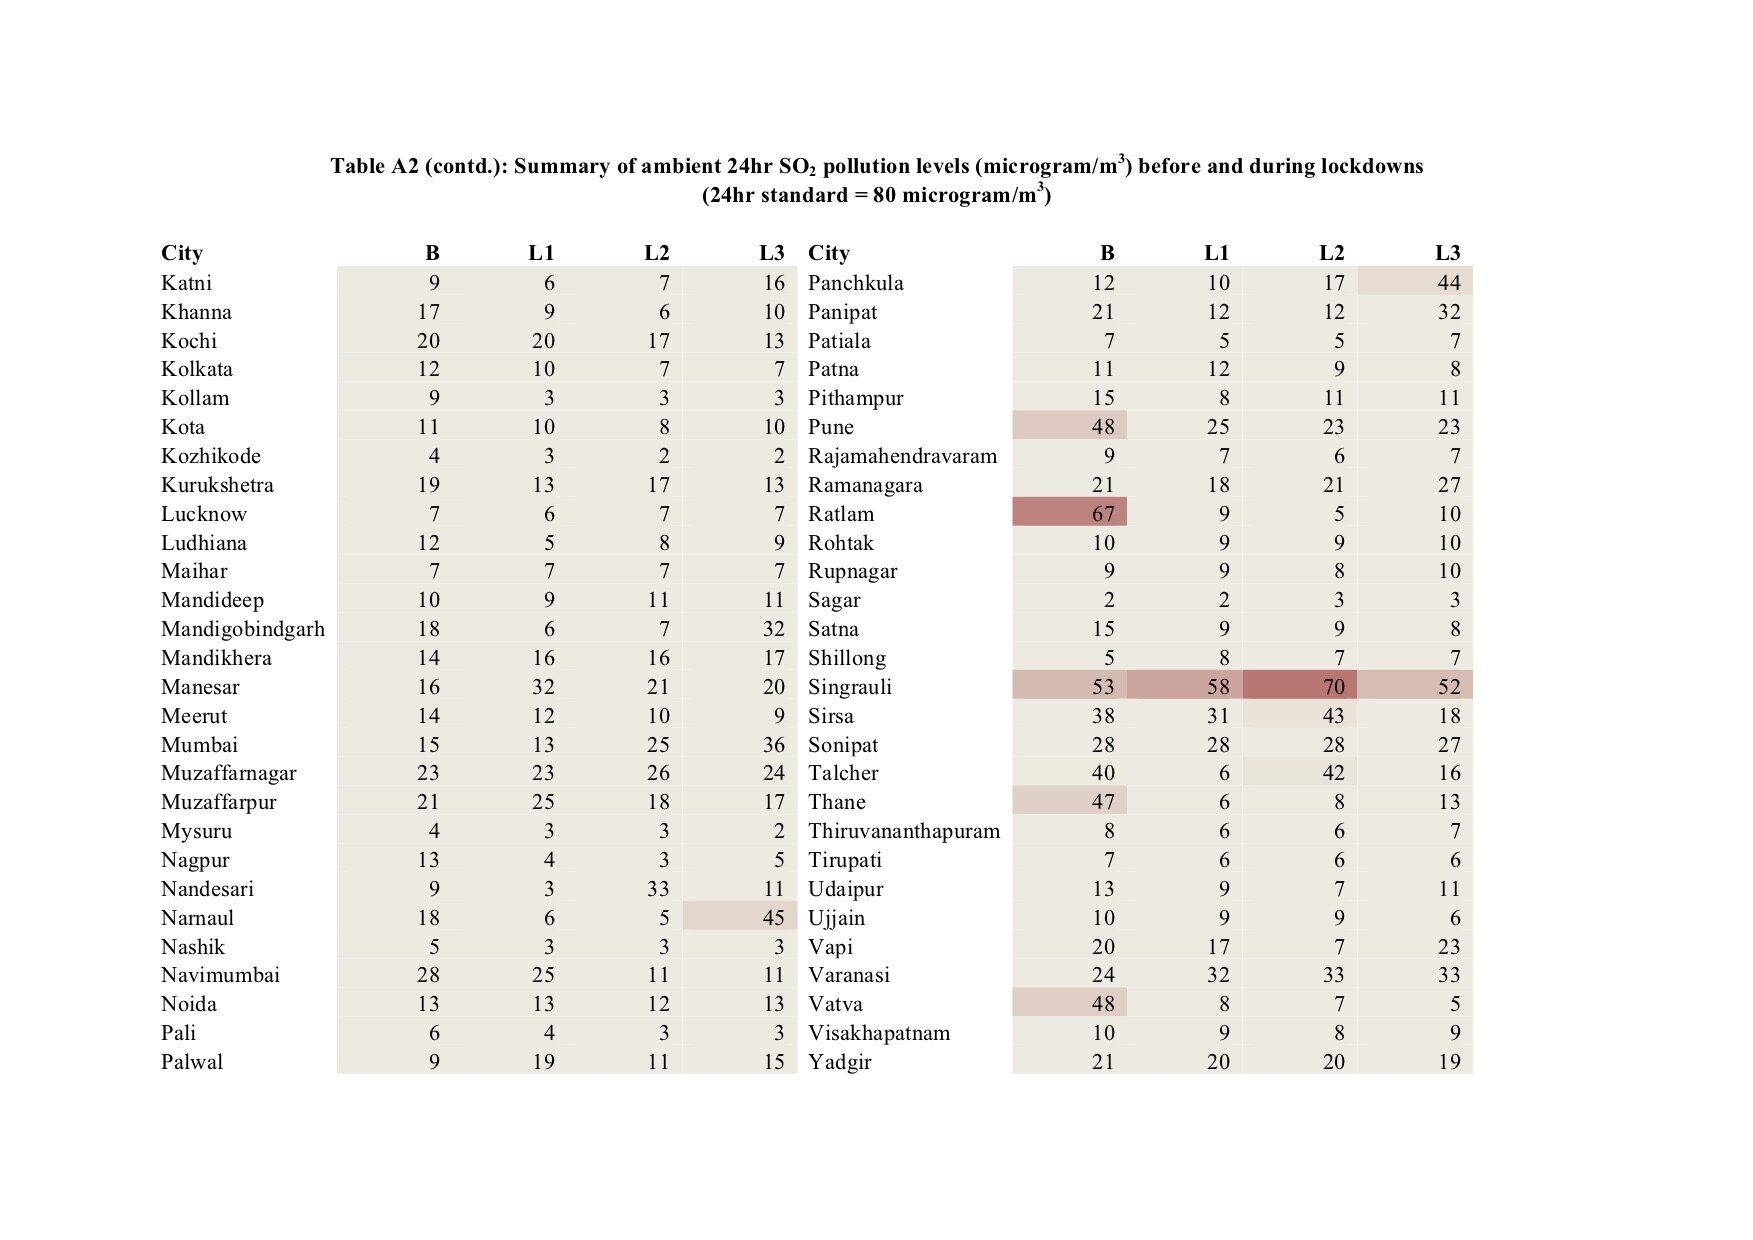
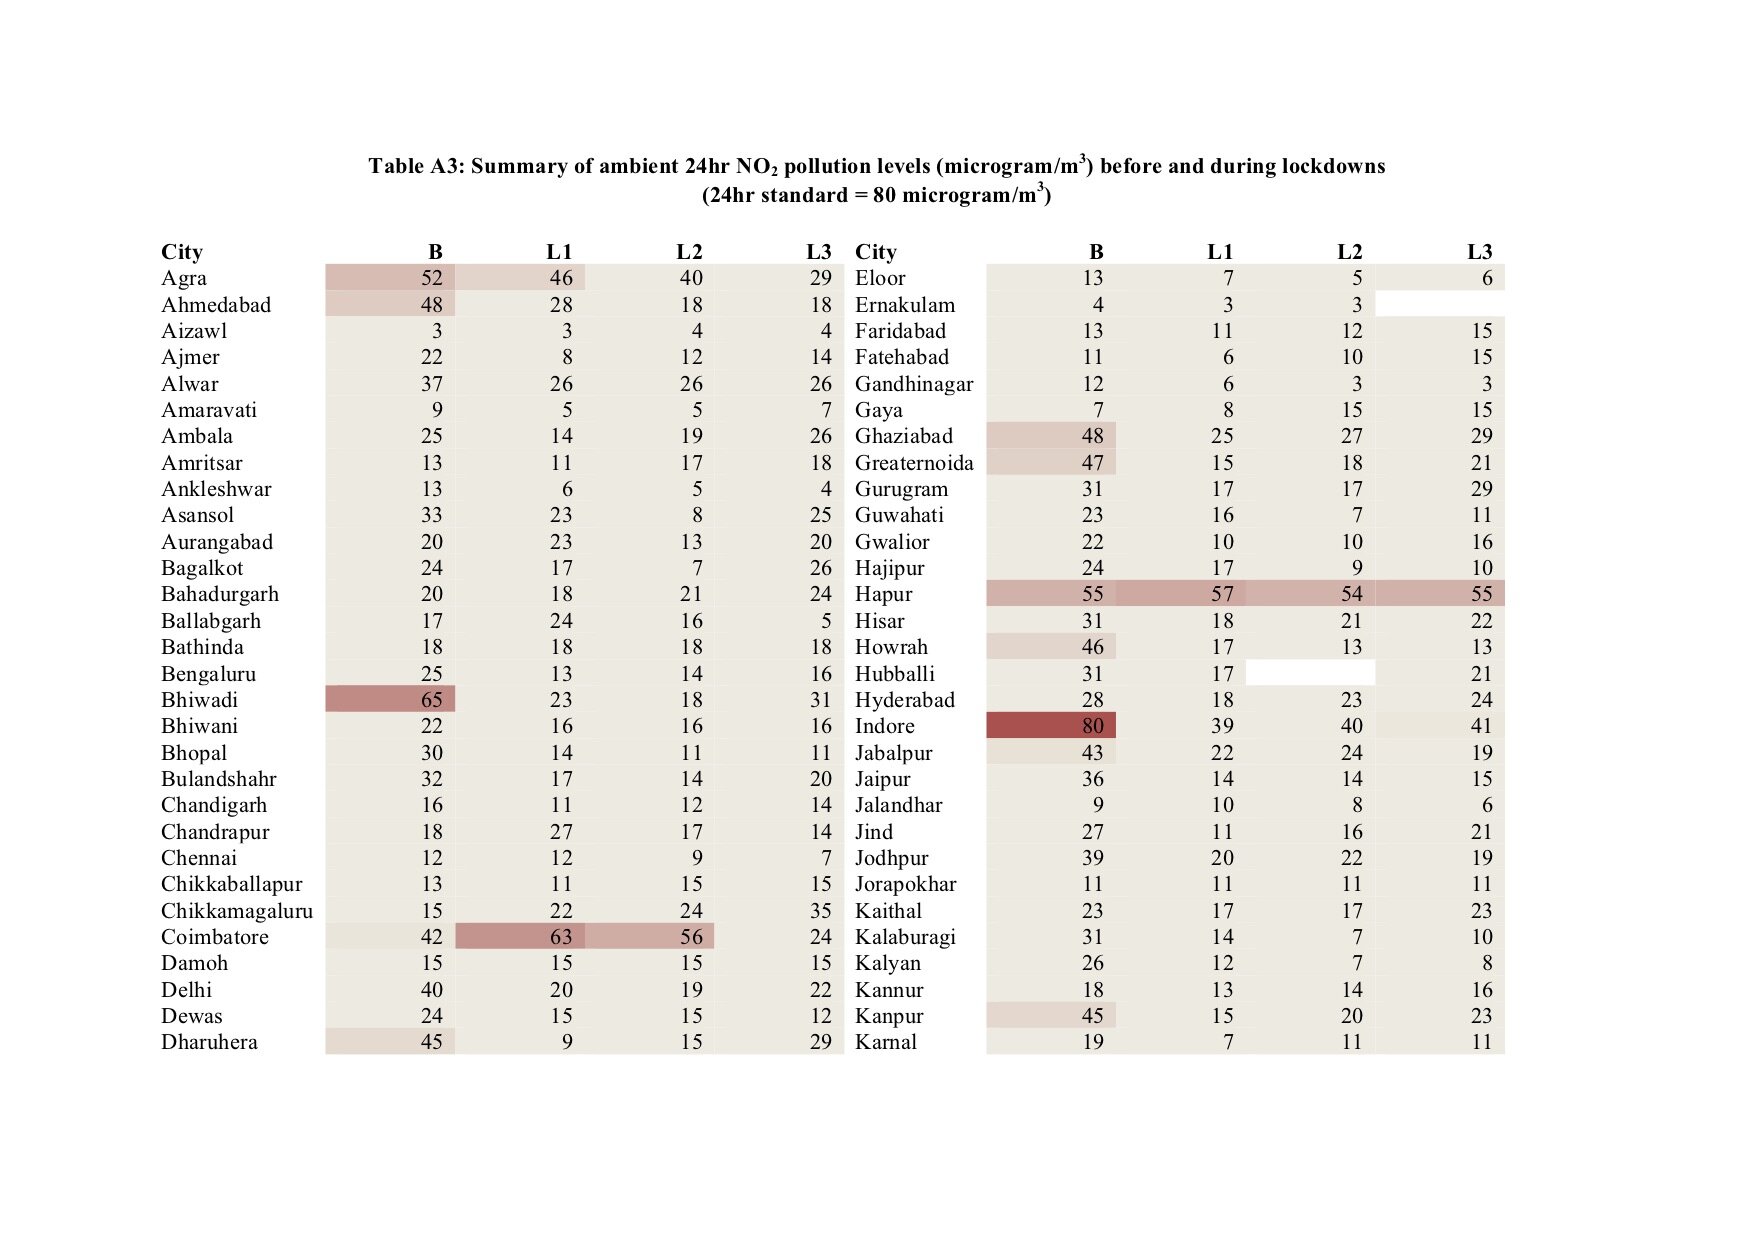
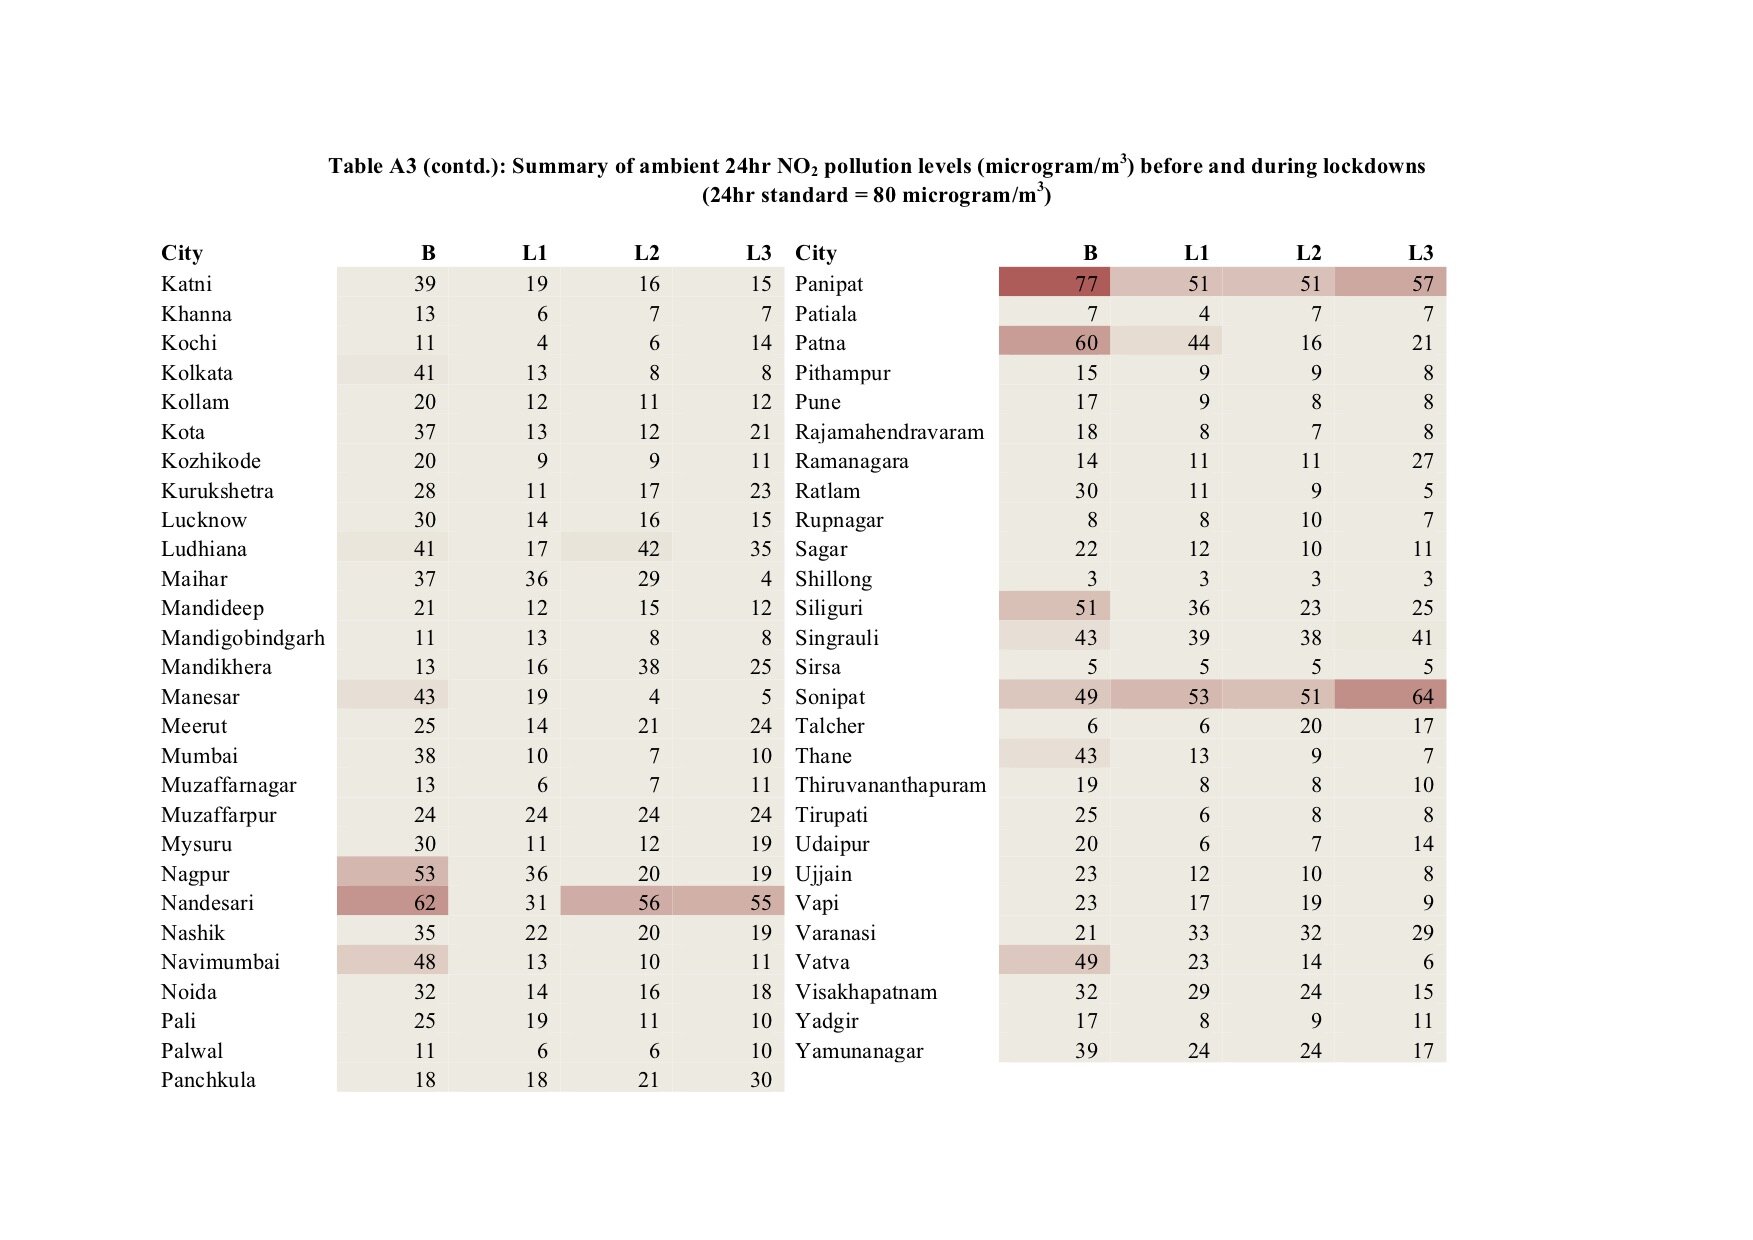
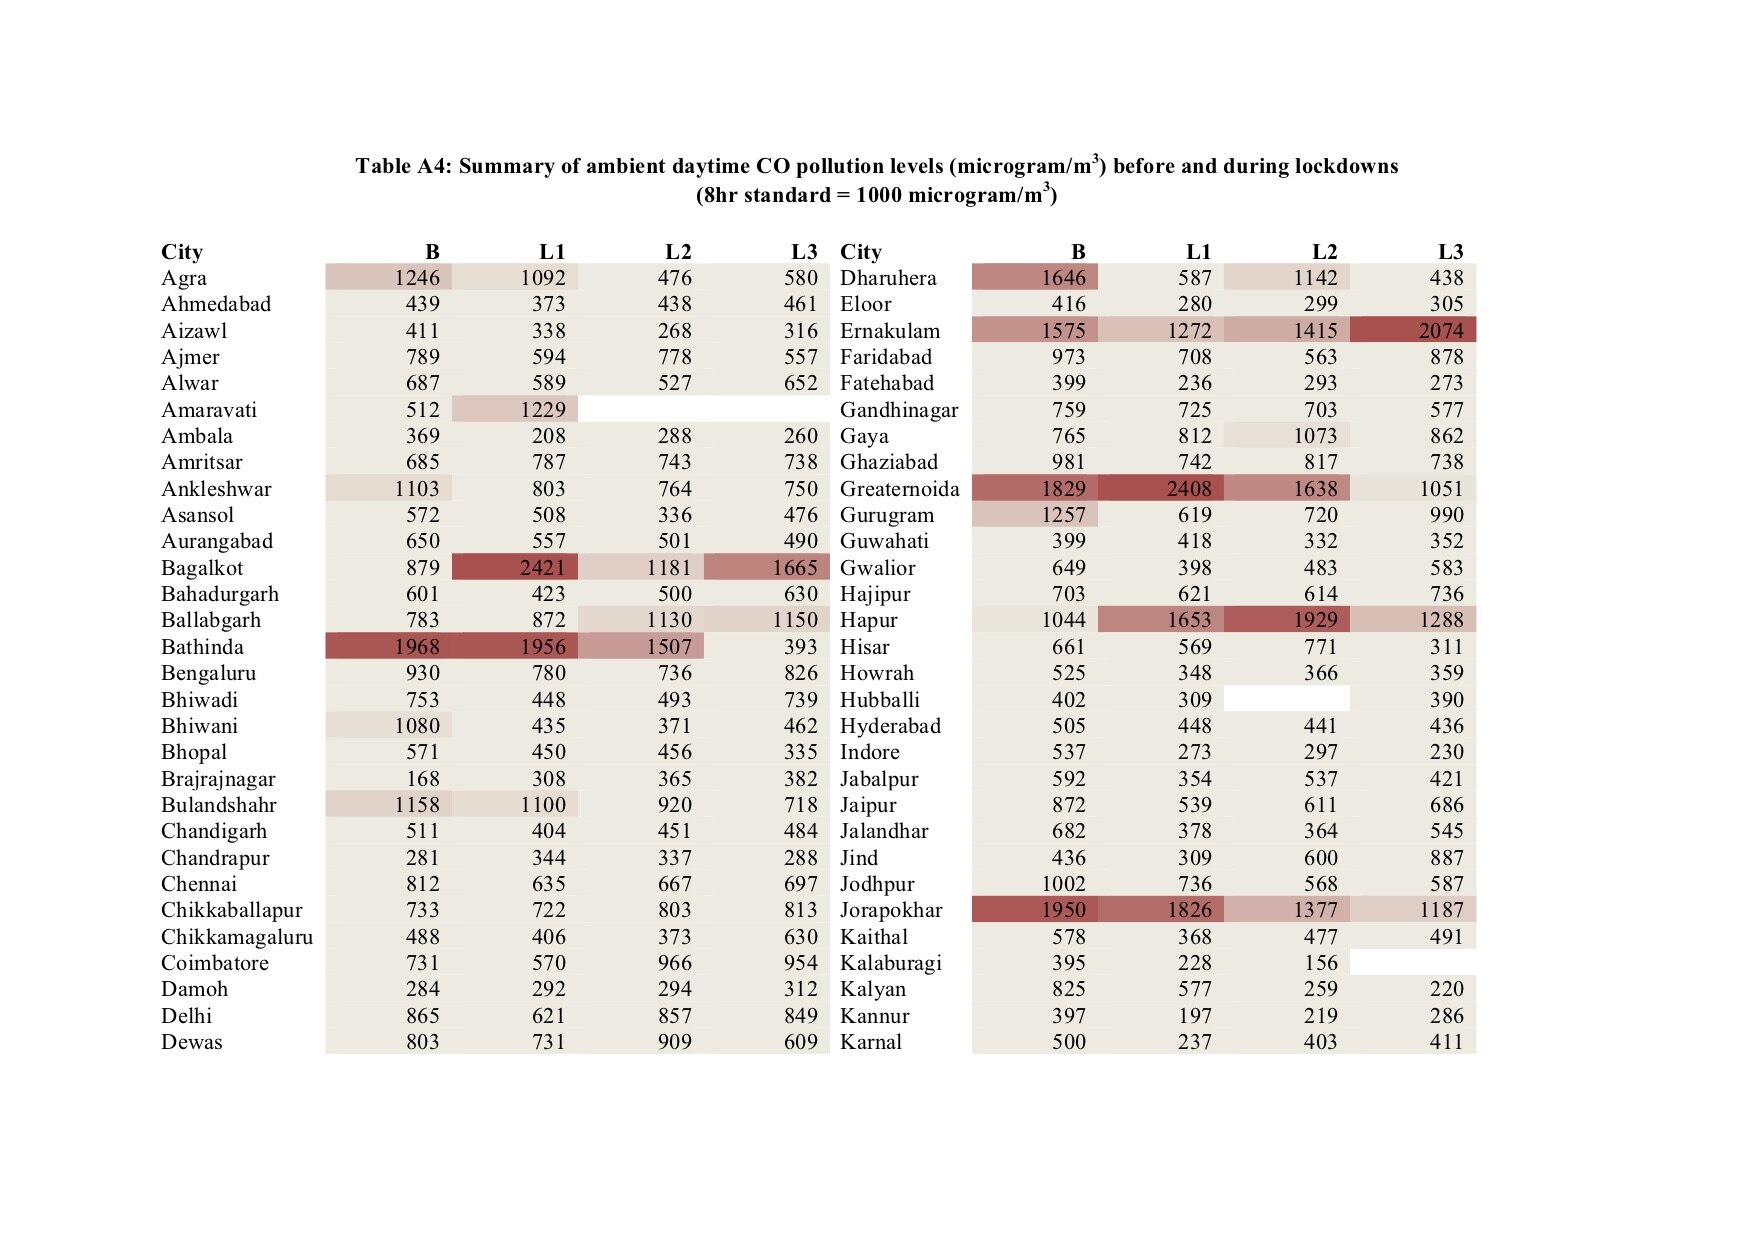
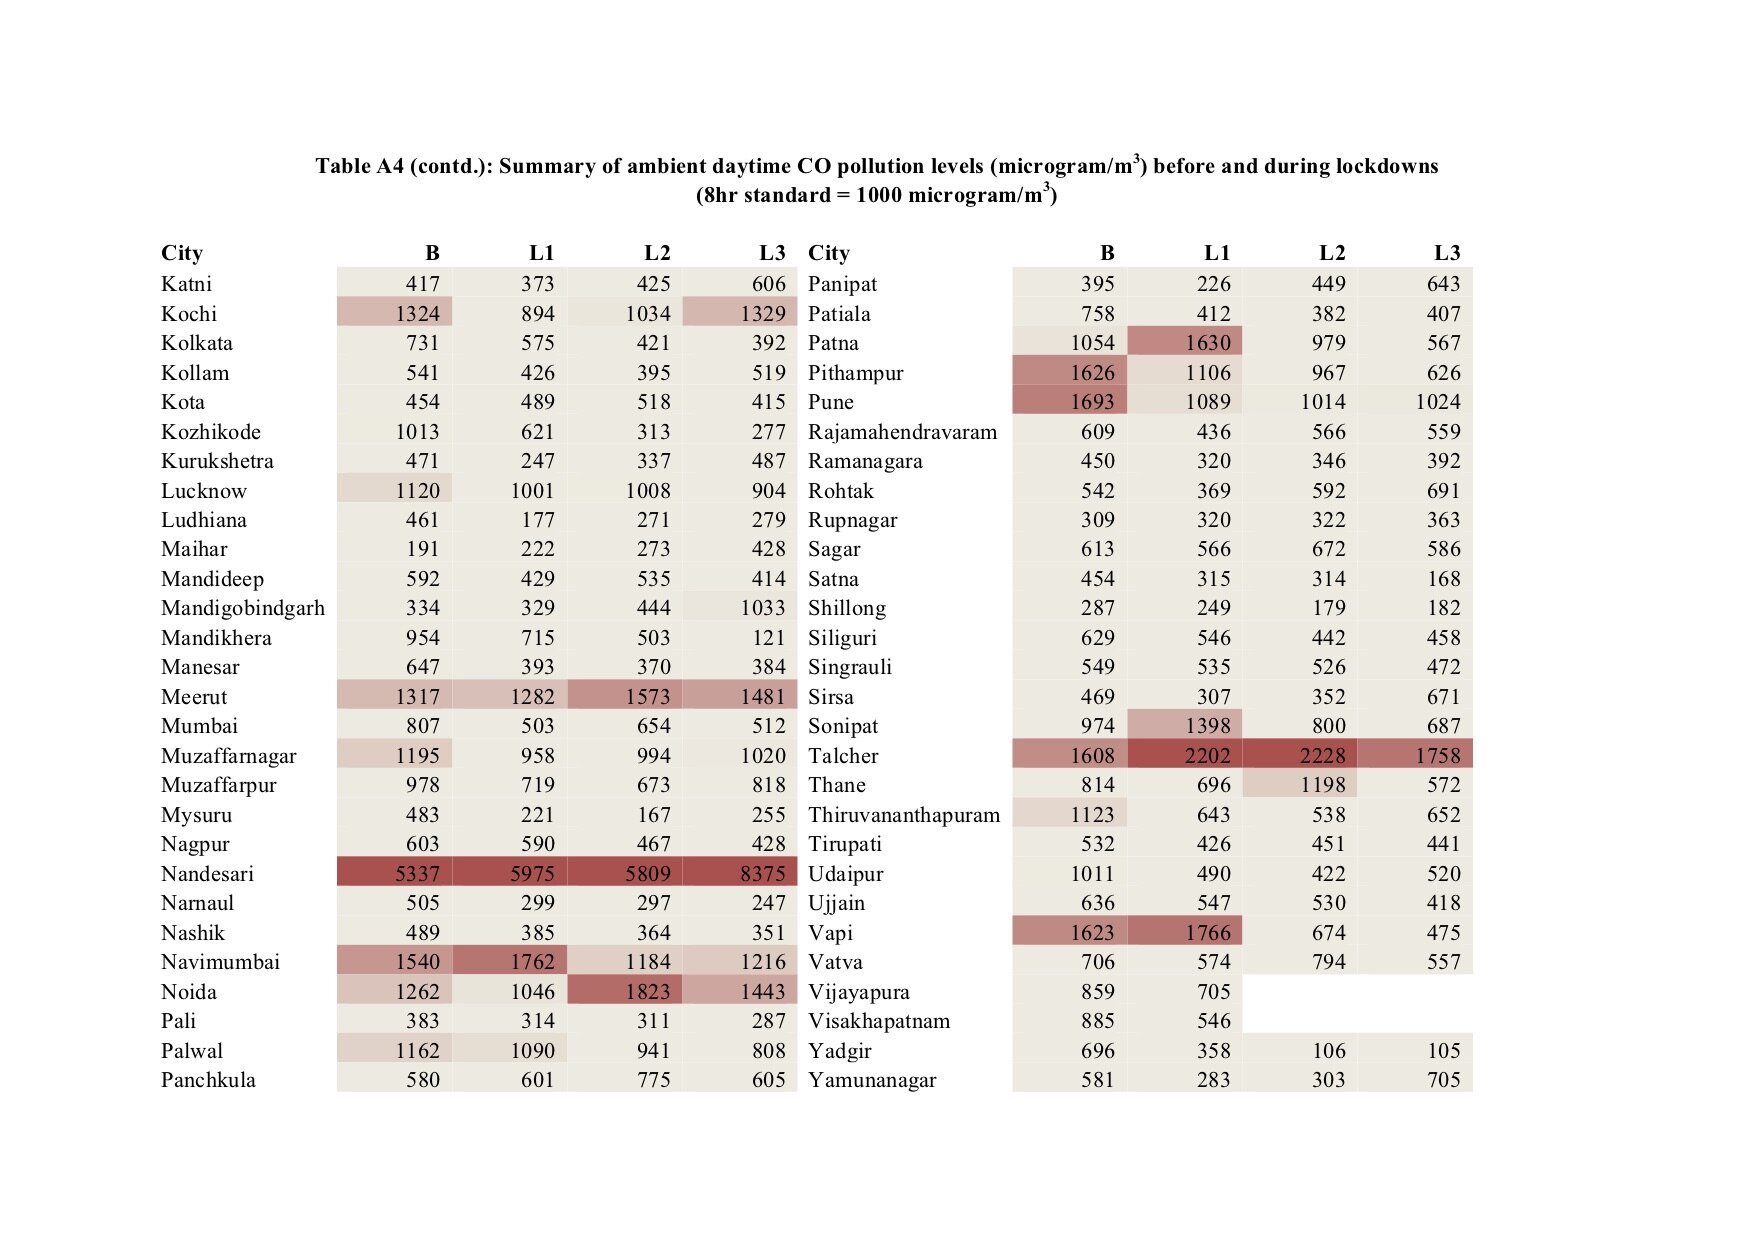
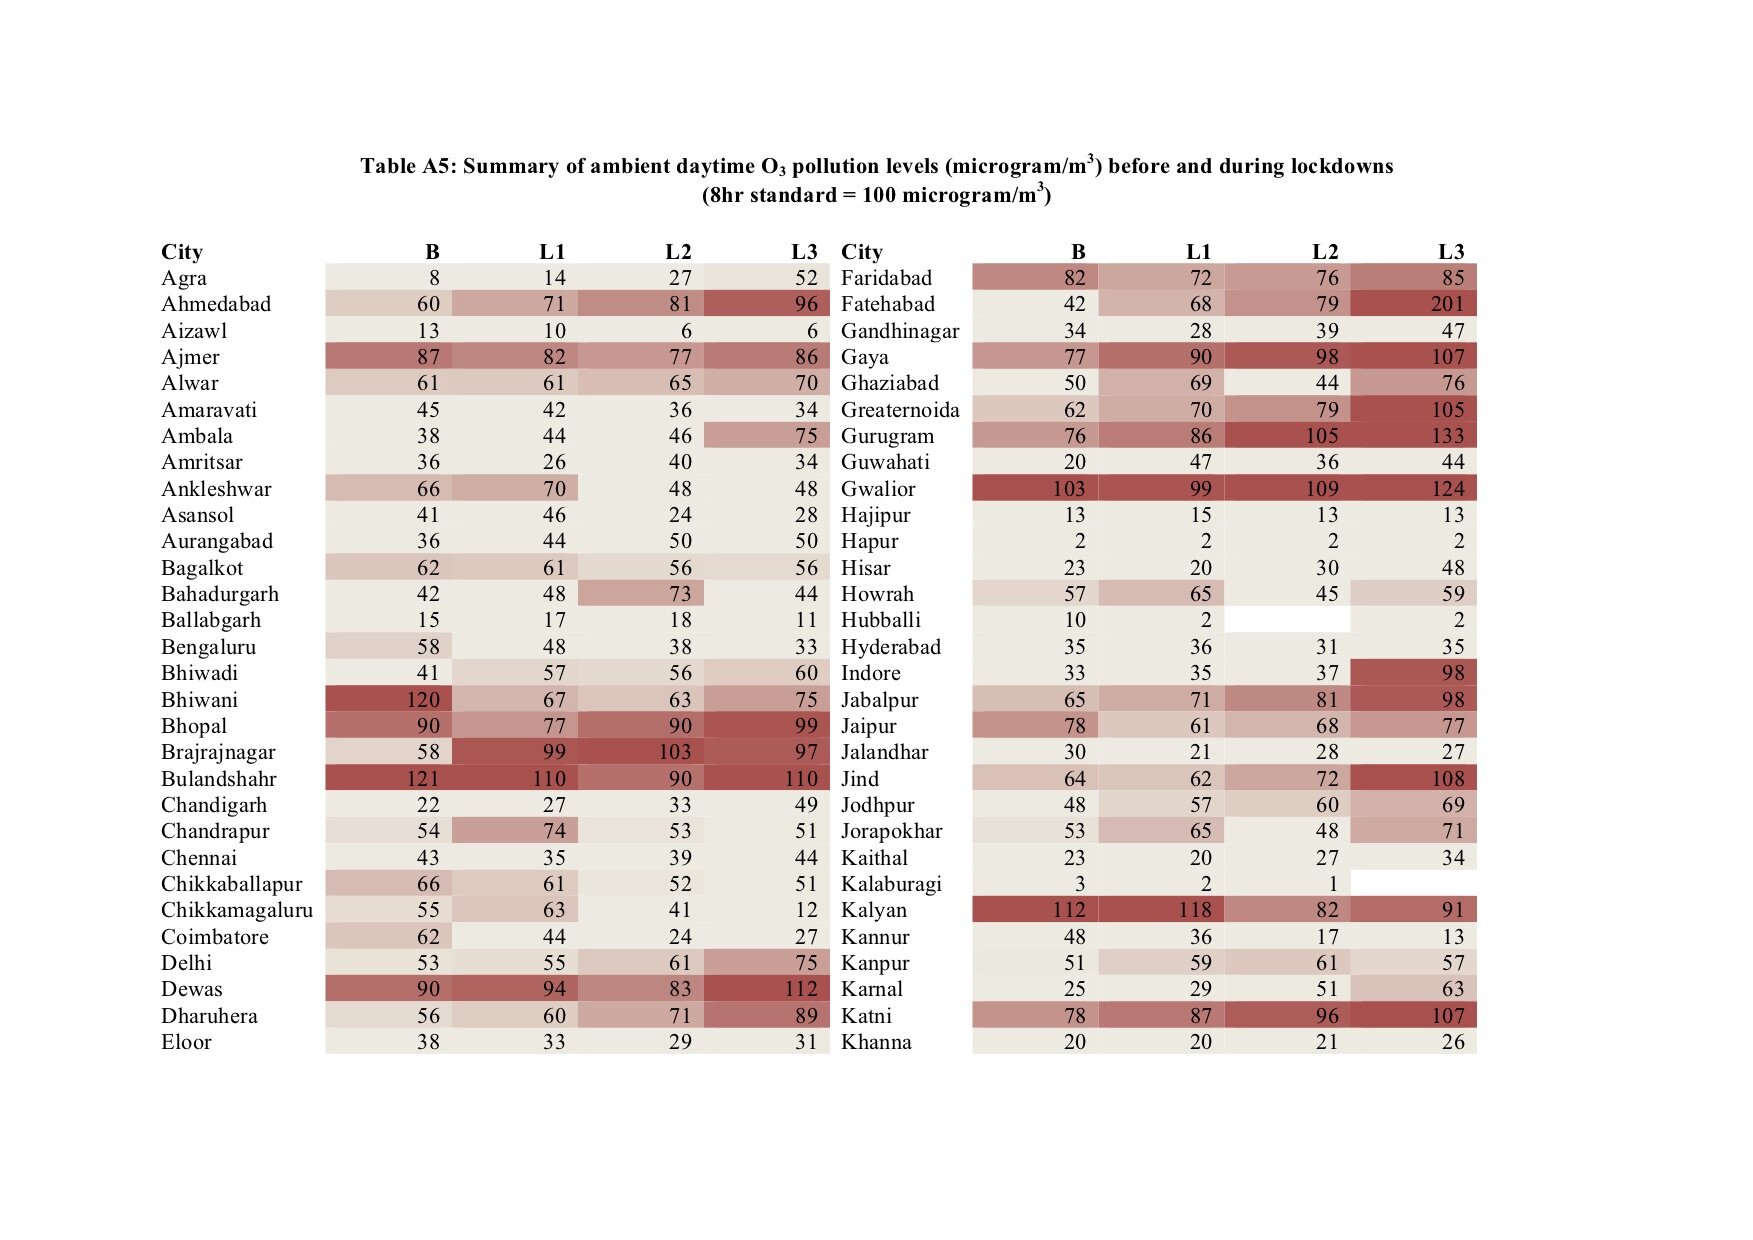
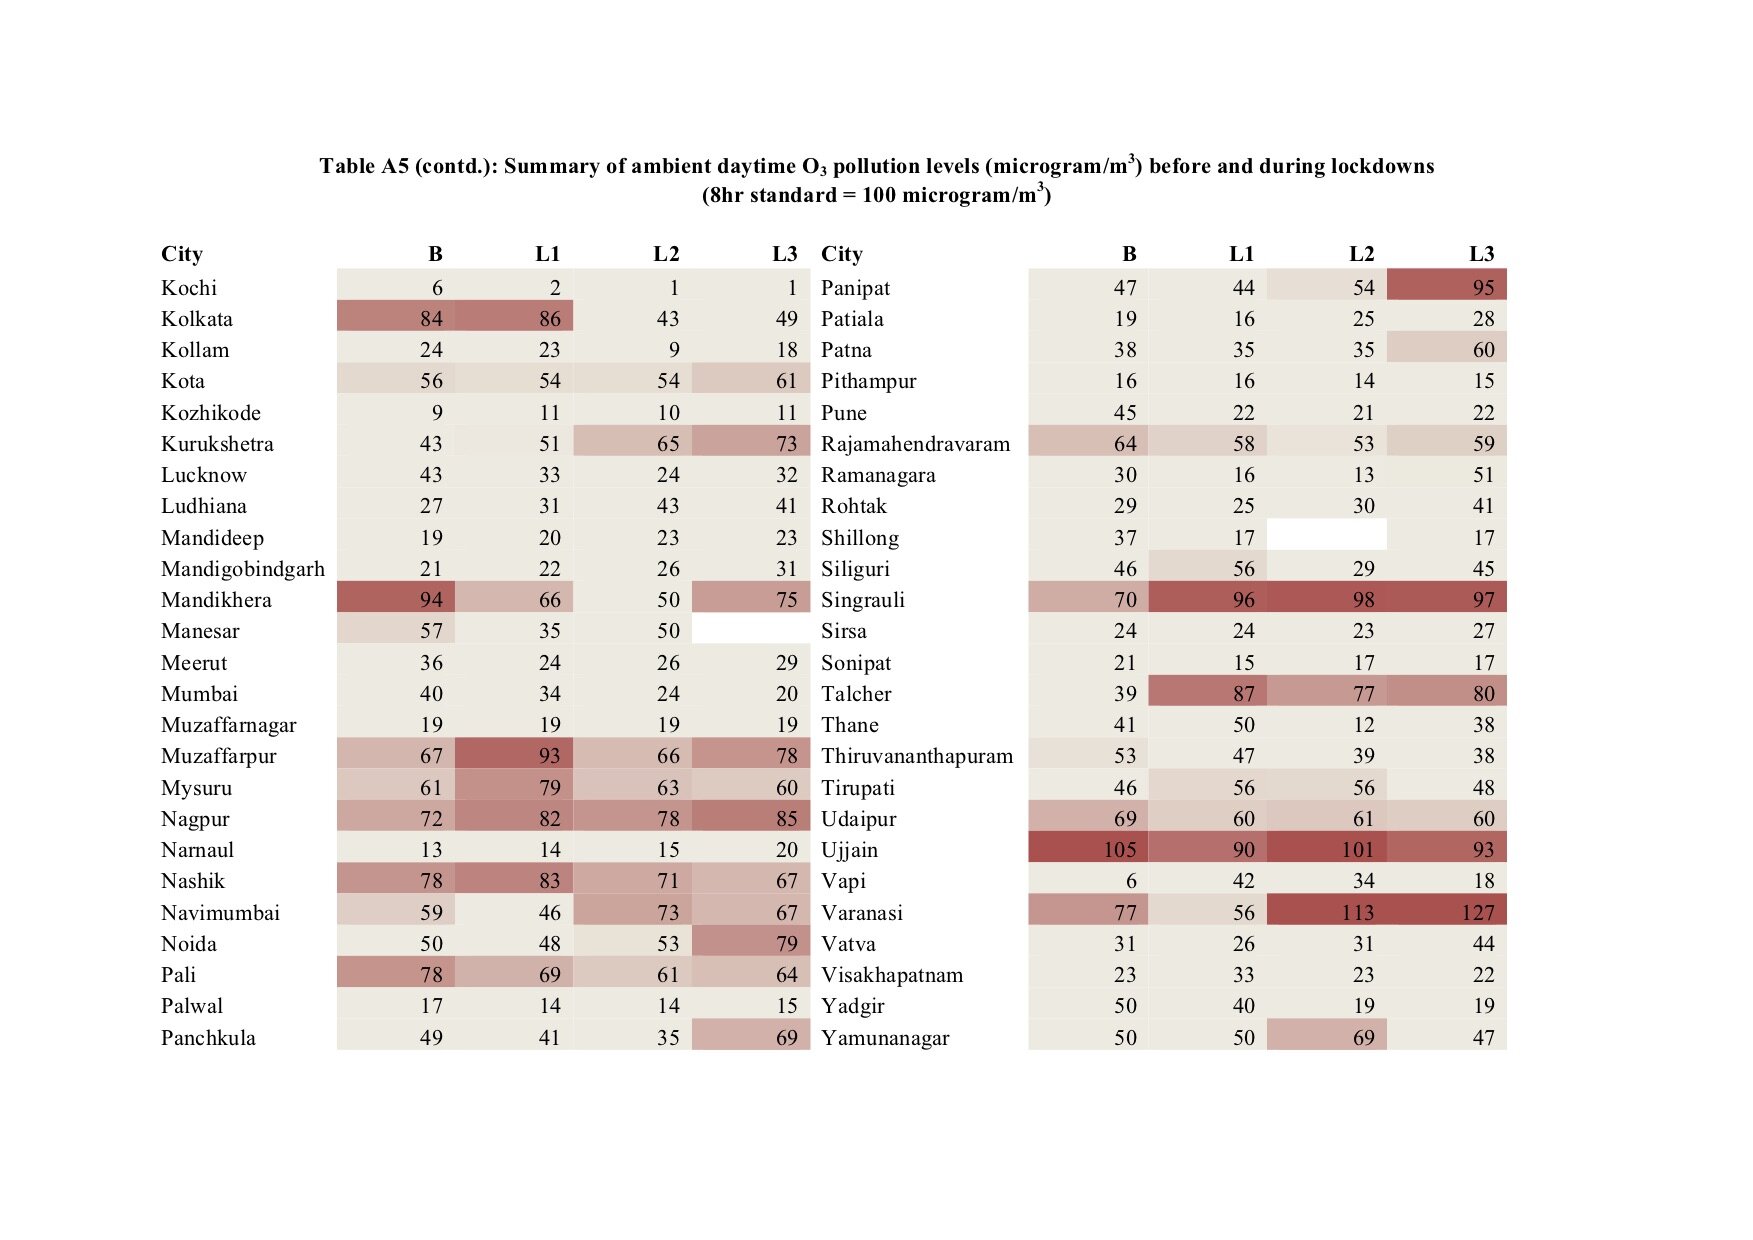
Summary of air quality data by city is presented in five bins – over the 30 days before the lockdown began (B); lockdown phase 1 (L1); lockdown phase 2 (L2); lockdown phase 3 (L3) and lockdown phase 4 (L4). Table 2 presents data for PM2.5, for the same bins; tables A1- A5 in the Appendix presents analogous summaries for PM10, SO2, NO2, CO, and Ozone. PM2.5, PM10, SO2, and NO2 concentrations are 24-hr averages. CO and Ozone concentrations are day-time averages. This is consistent with the methodology used in calculating the air quality index as described in the national methodology. All the tables (as csv) are accessible at https://urbanemissions.info/india-airquality-covid19
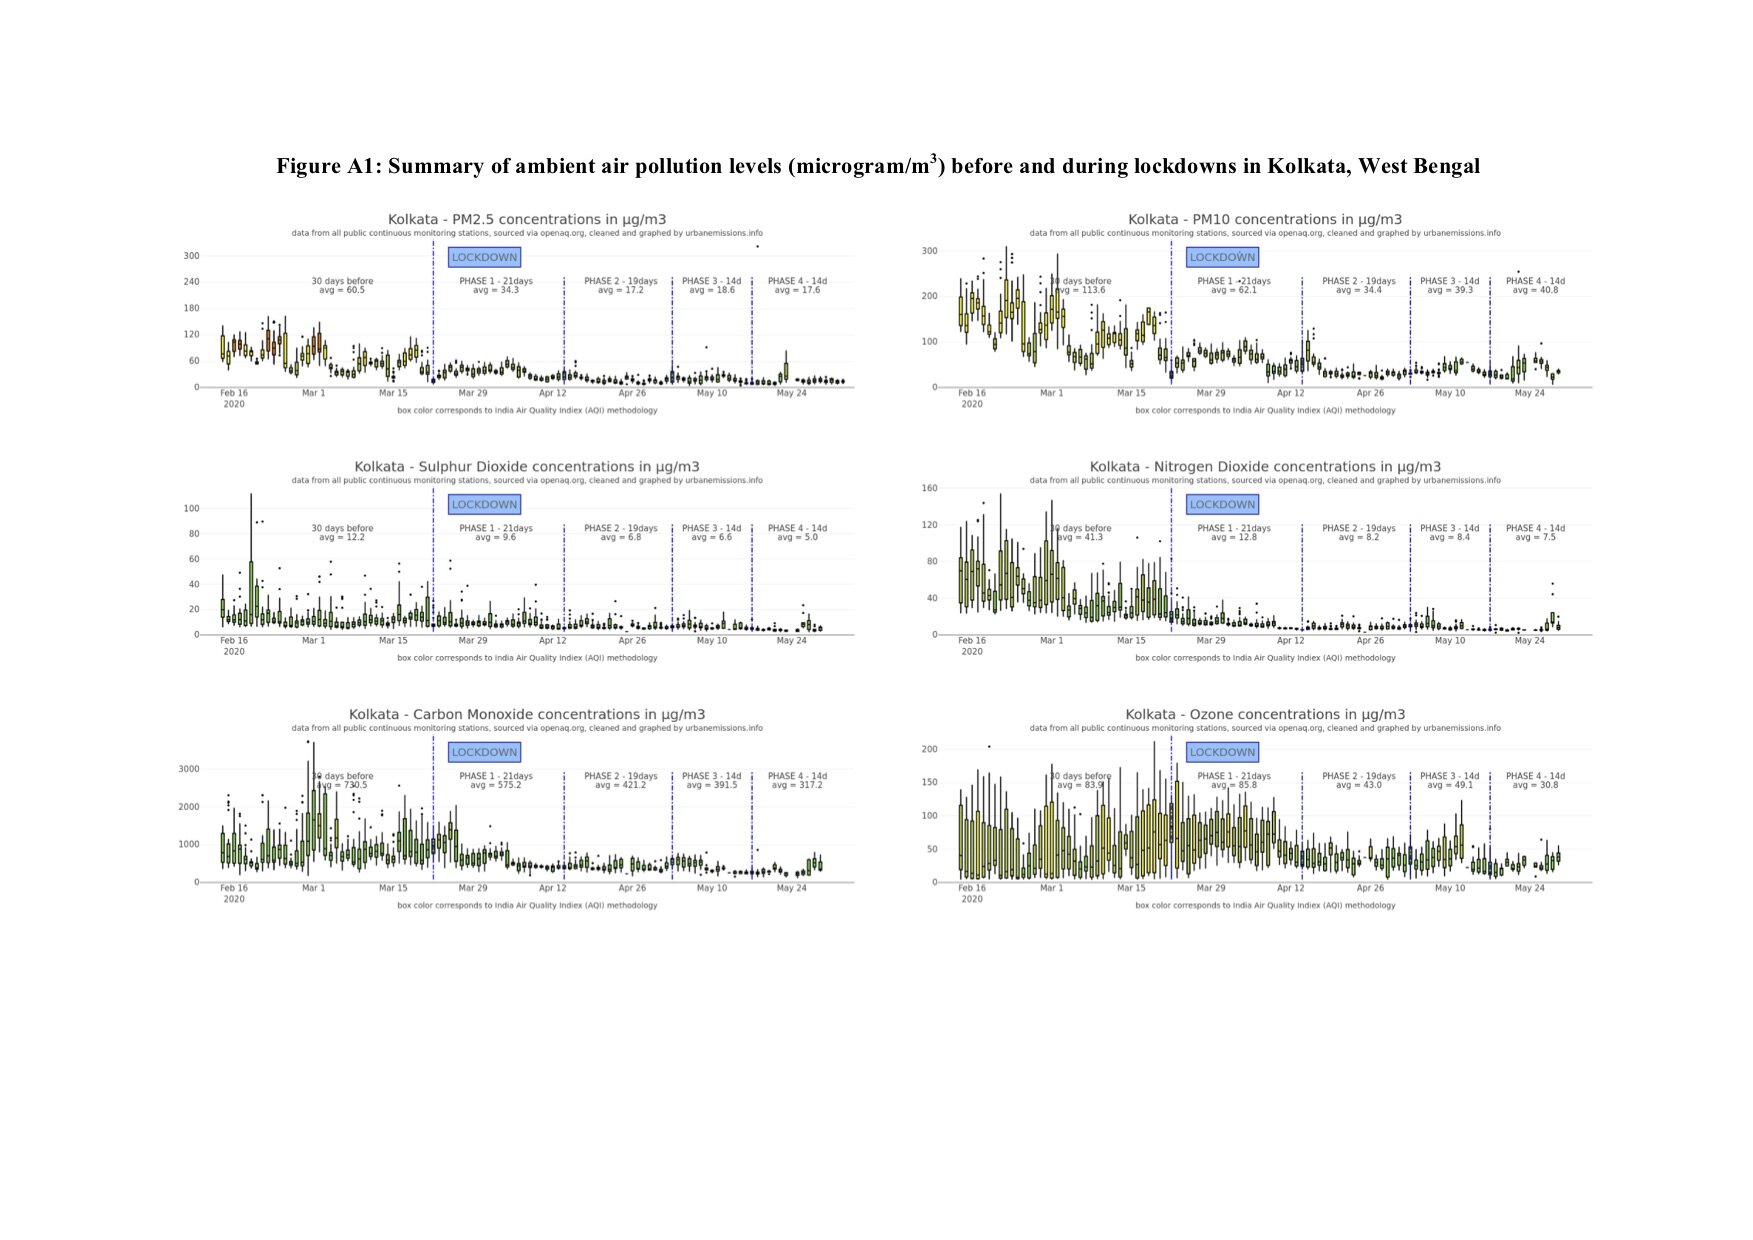
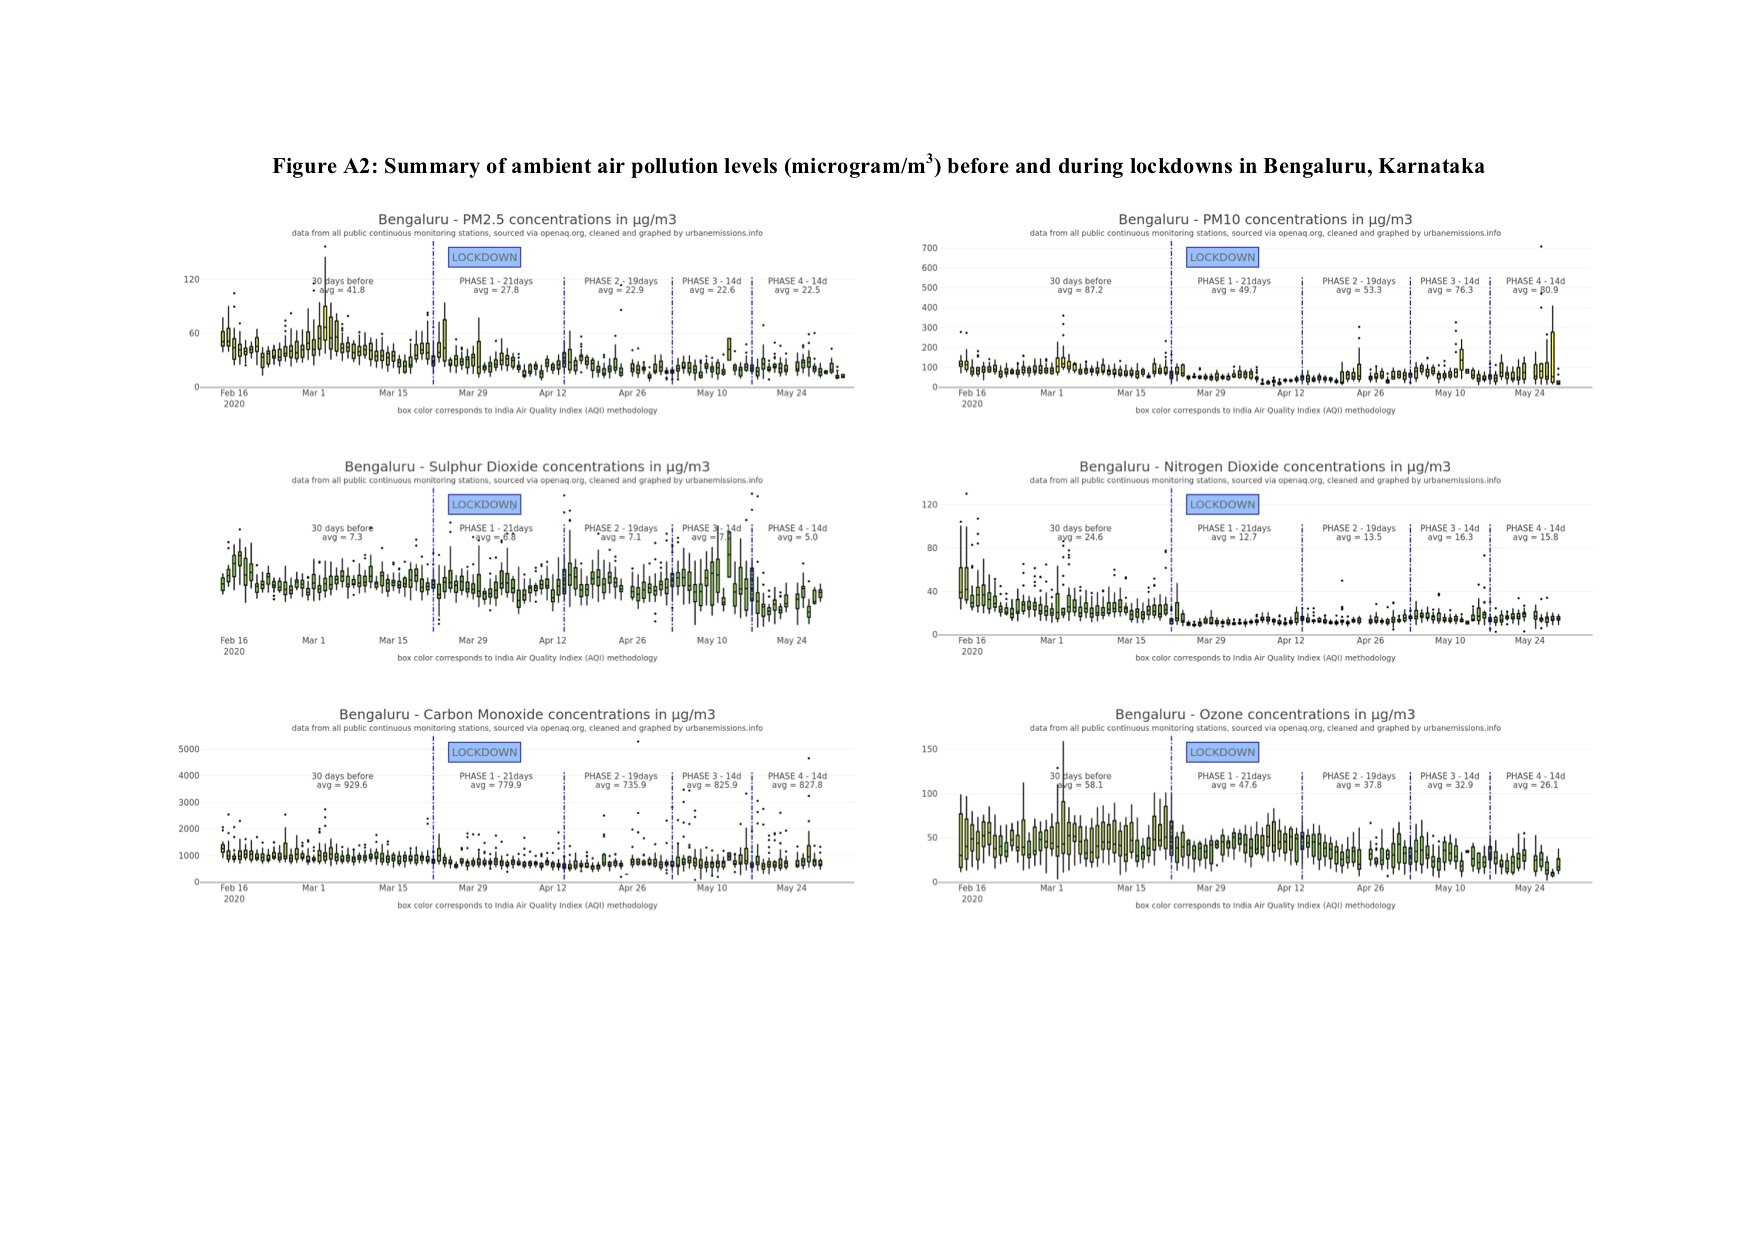
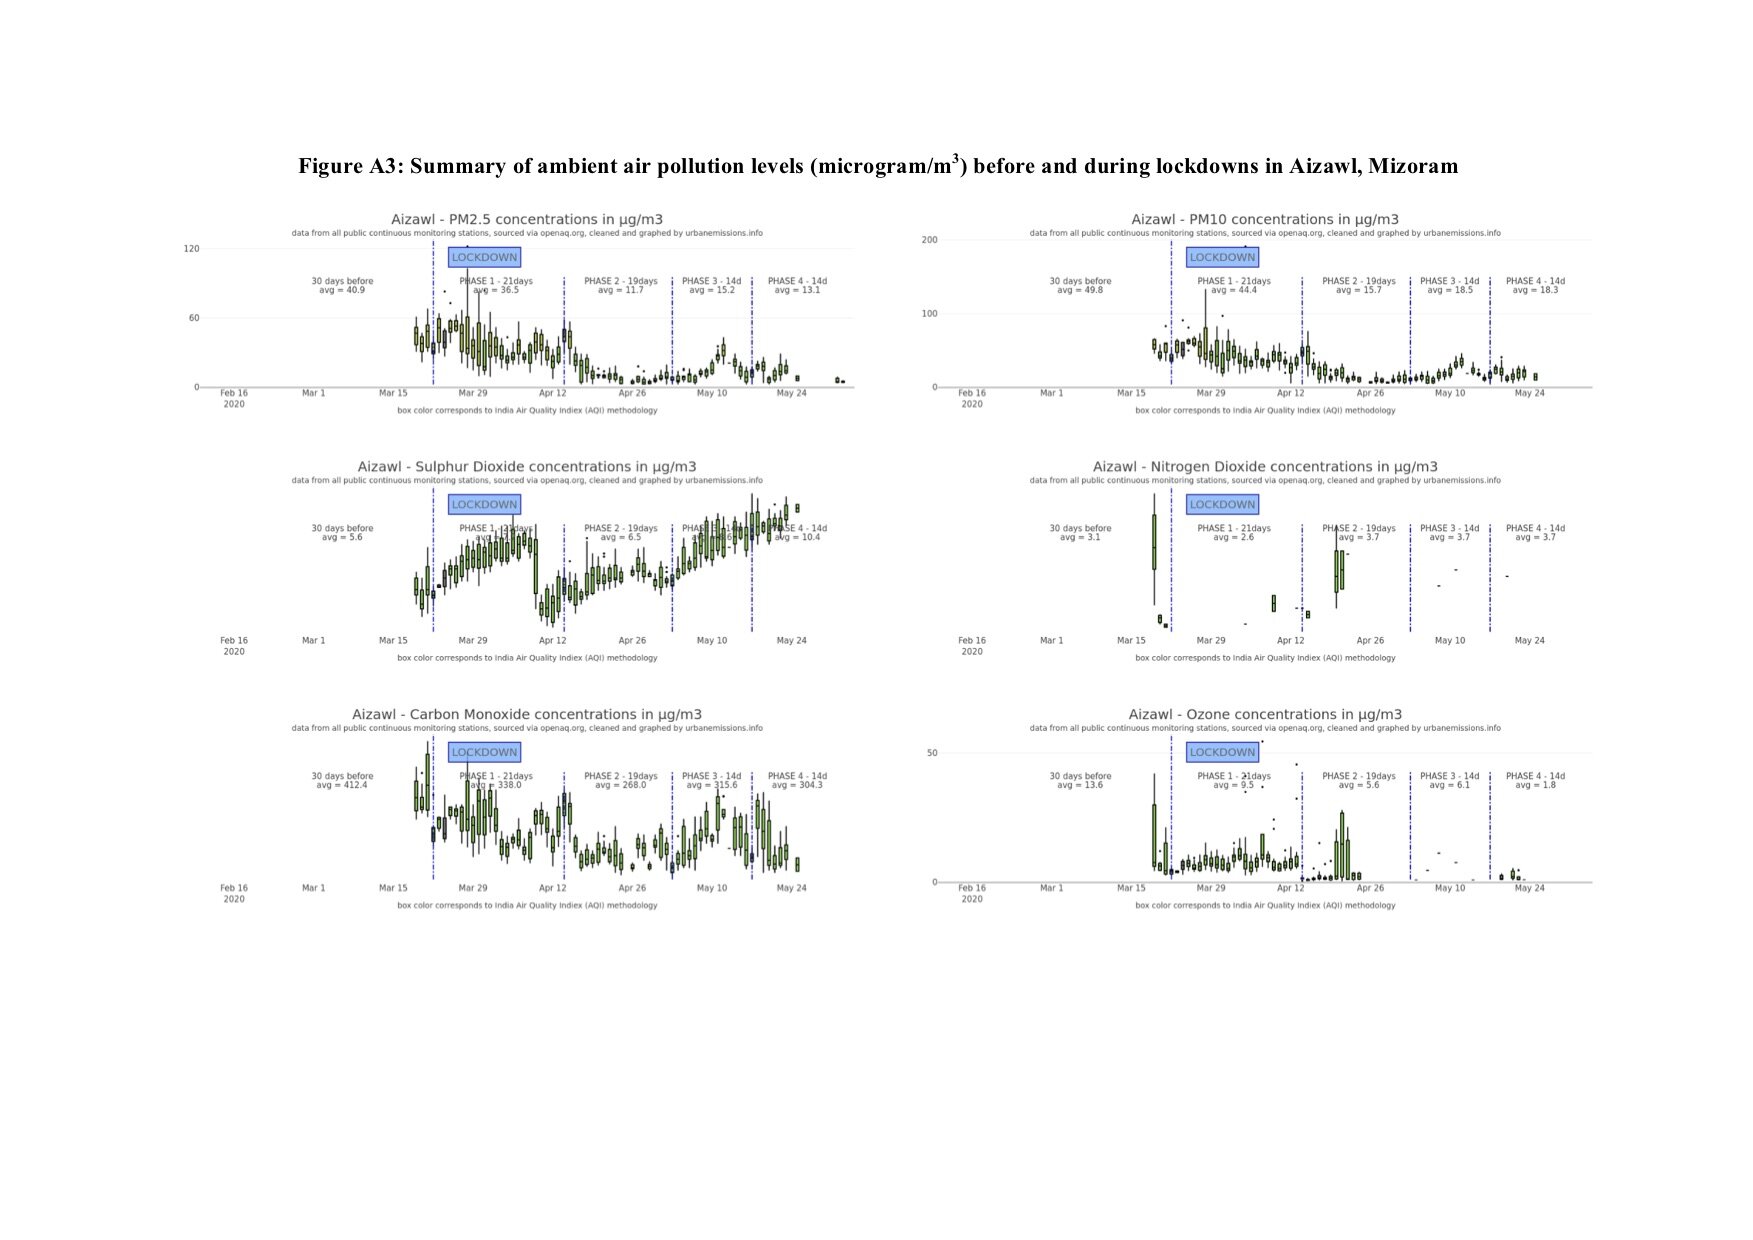
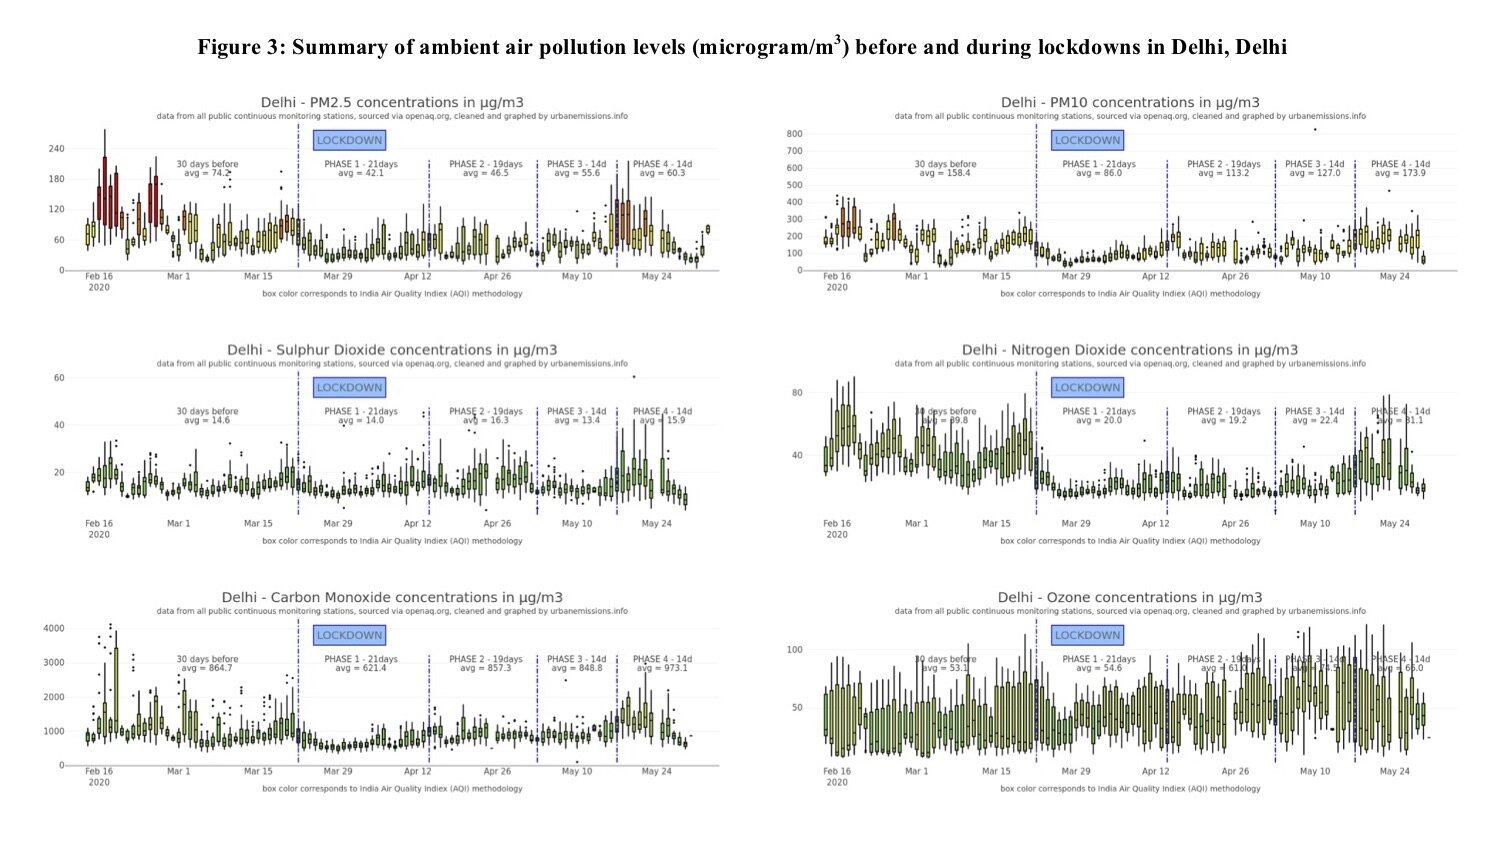
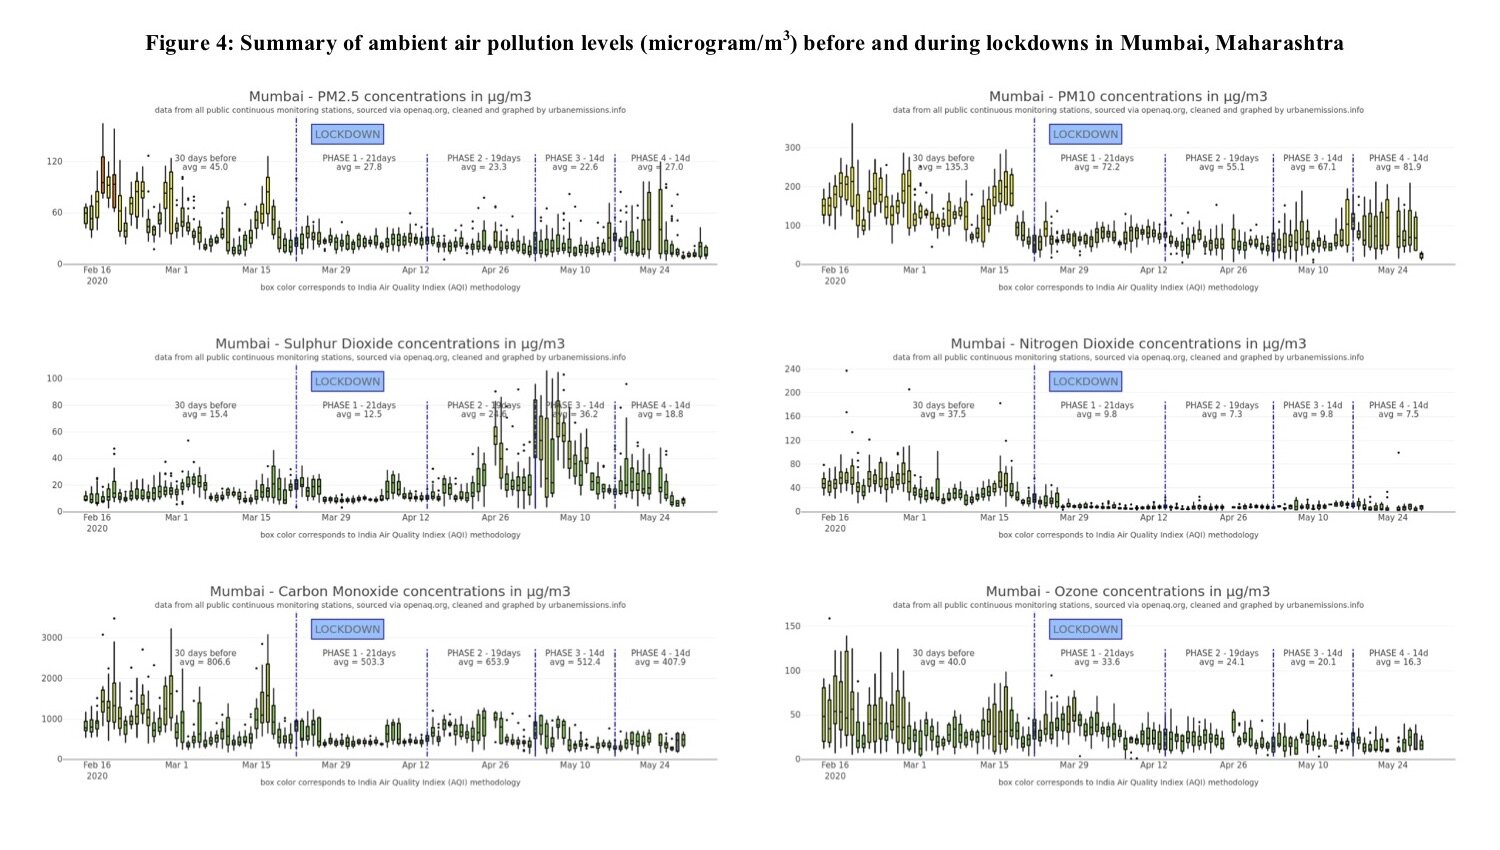
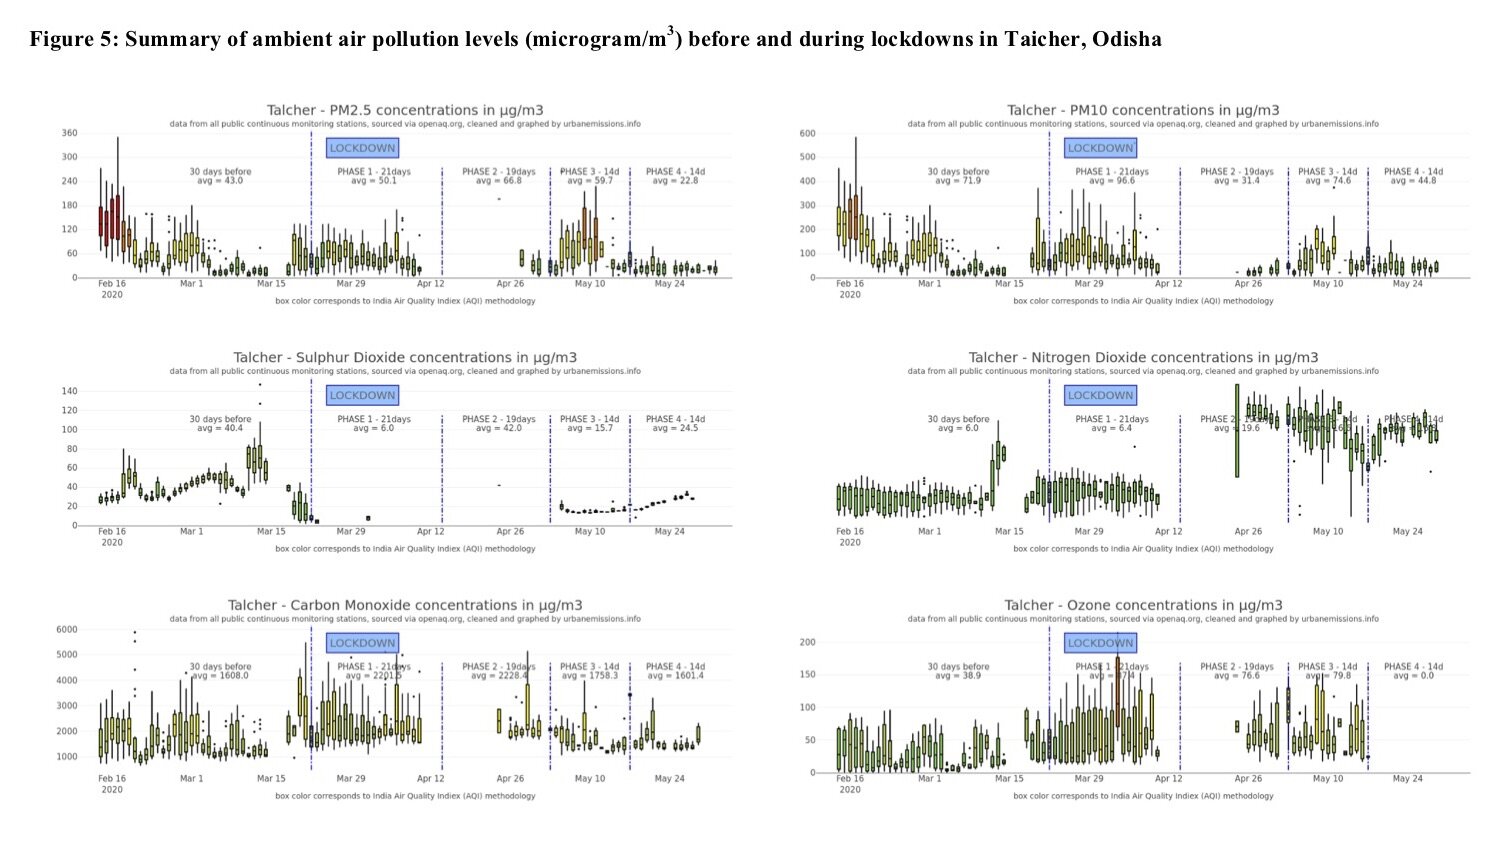
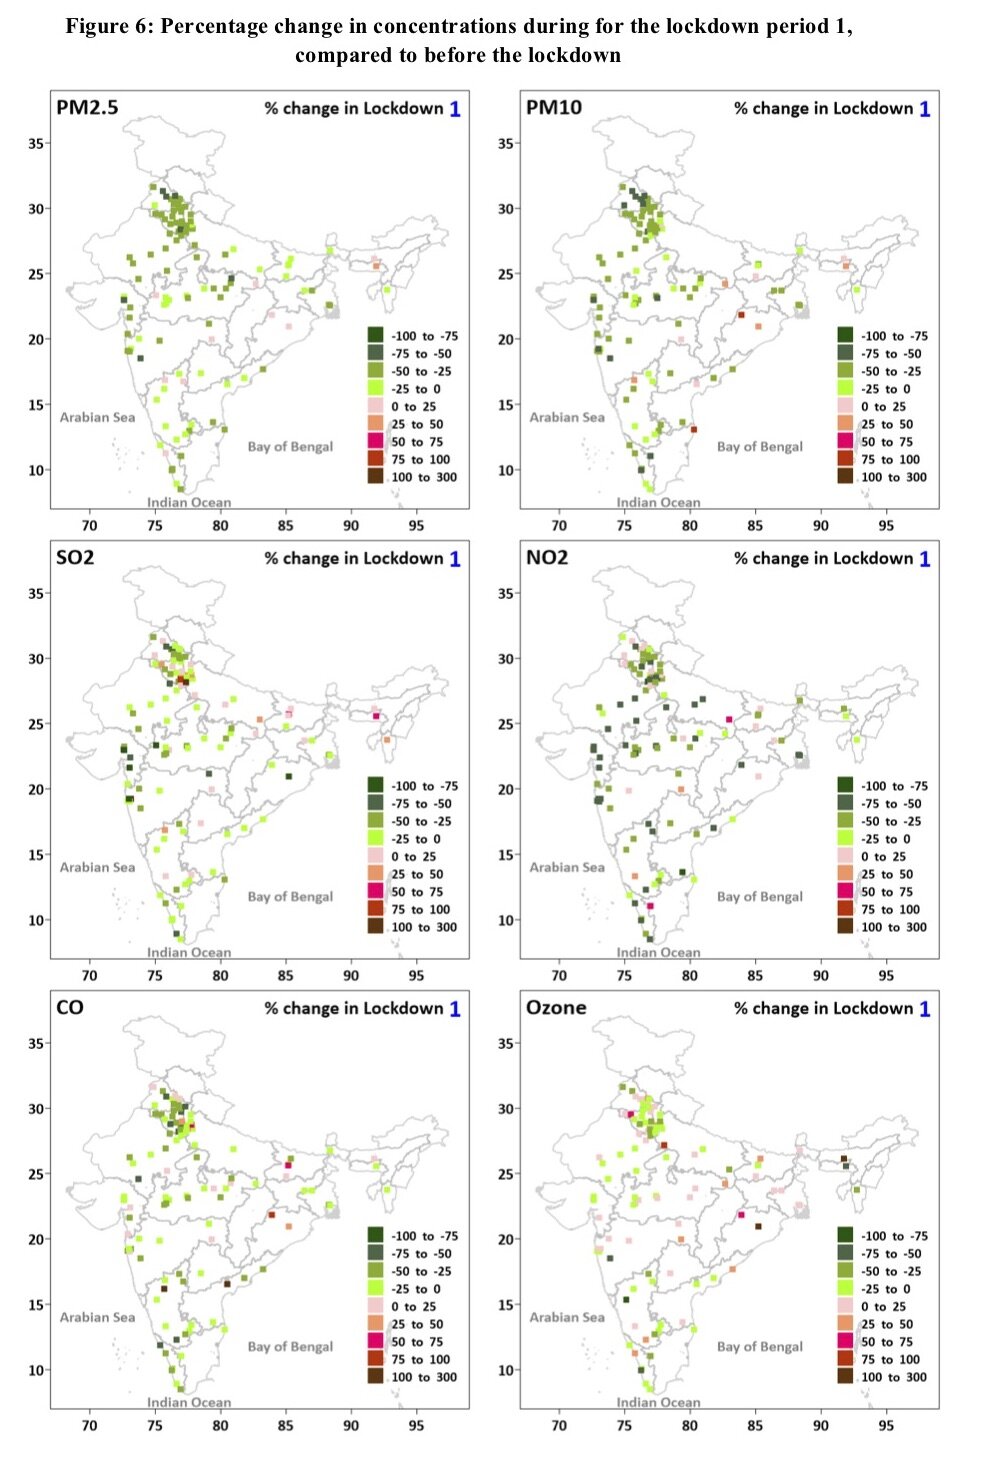
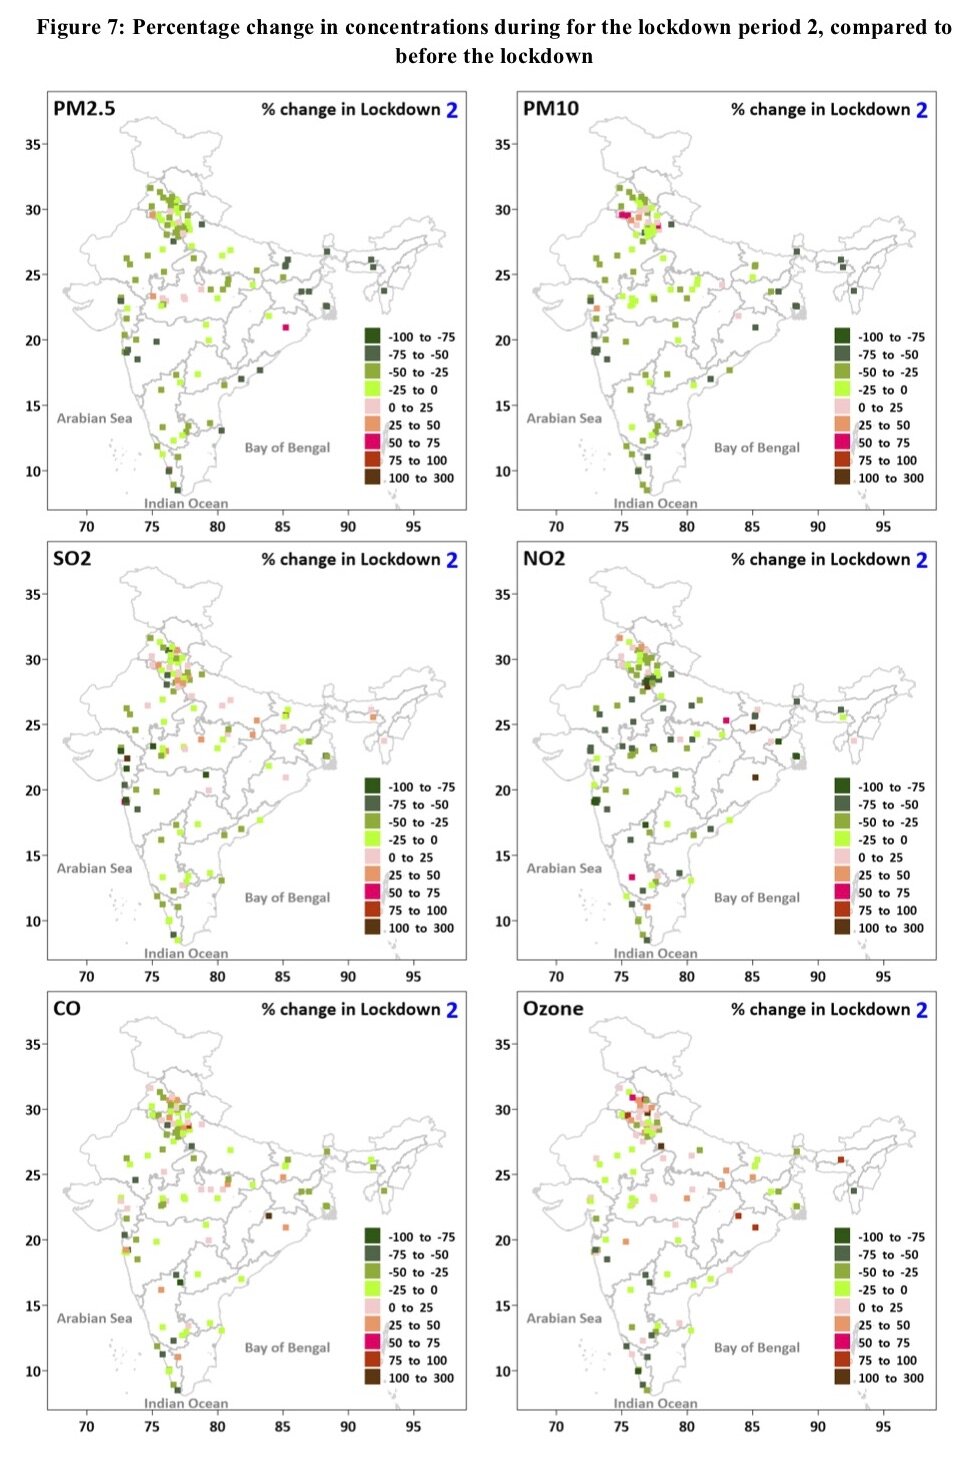
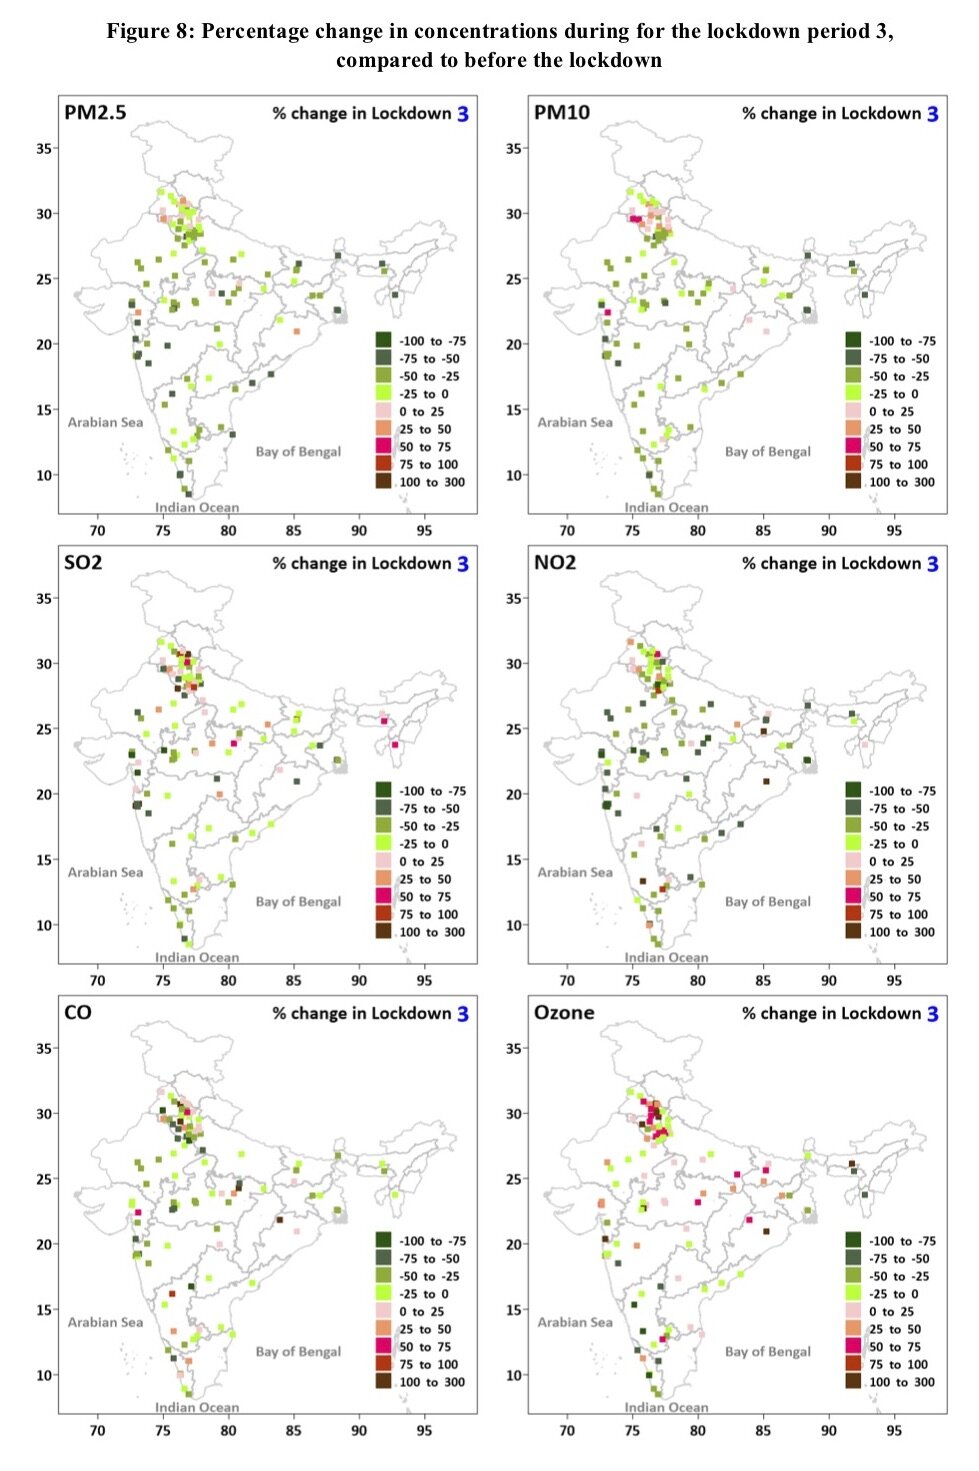
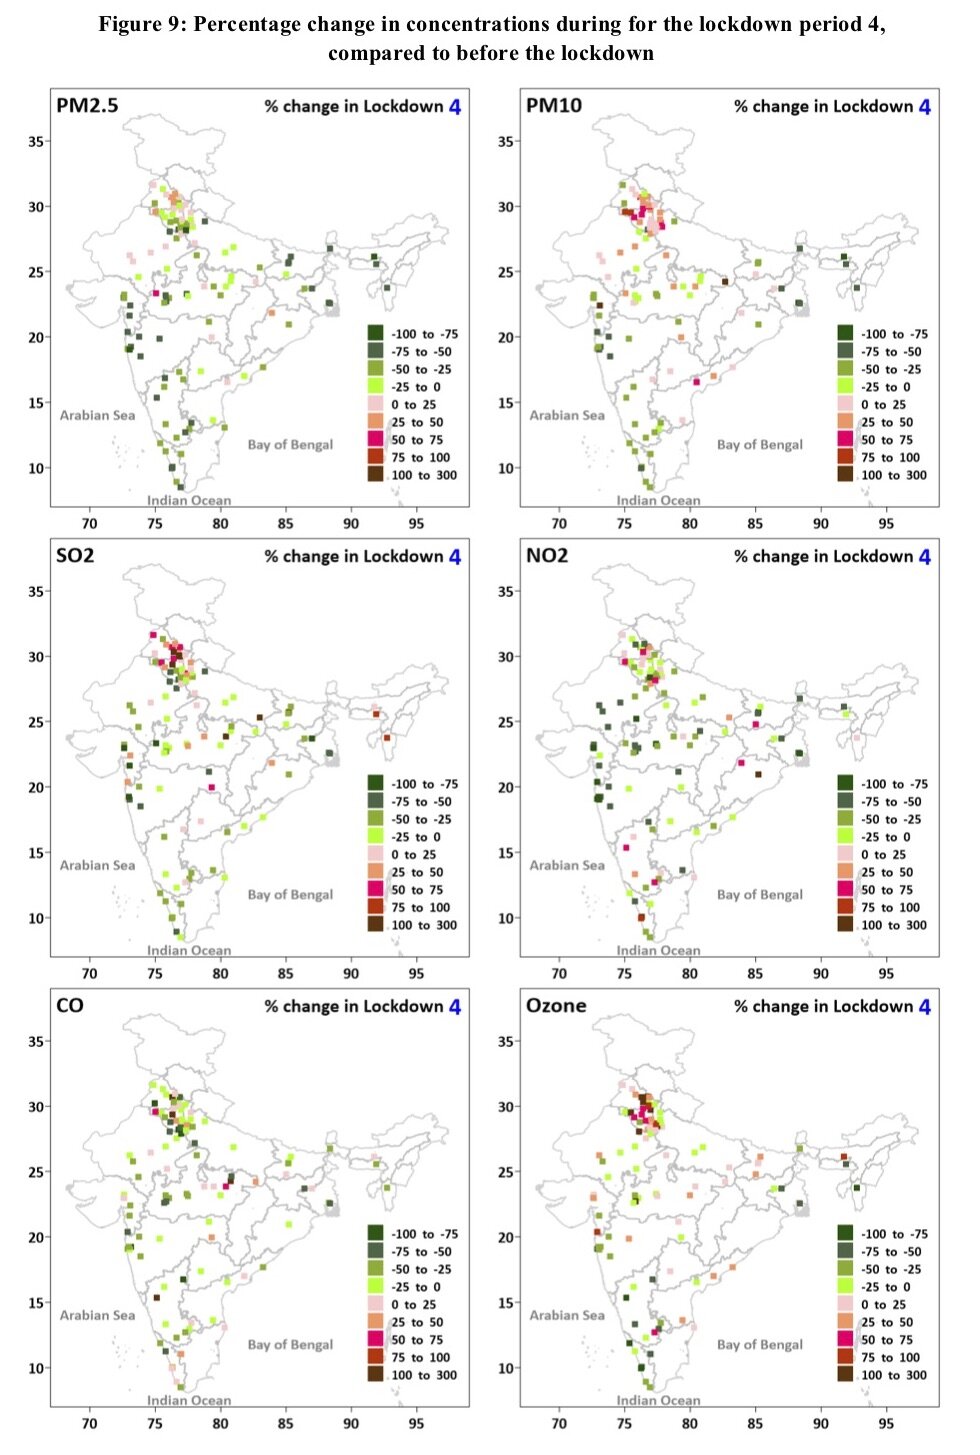
For convenience, a summary of hourly concentrations by day for all five bins is presented in Figure 3-5 only for two big cities, Delhi and Mumbai, and one industrial area Talcher. Analogous summaries for two other metros- Bengaluru, and Kolkata- and one Tier-2 city from the Northeast – Aizawl are provided in Figures A1- A3 in the Appendix. Figures 6-9 present percentage change in ambient concentrations across India, compared to the pre-lockdown (B) period
Figures 3-5 below:
Figures 6-9 below:
3.1 General observations
In India, April and early May typically witness clean air in any year. This period is marked with good wind conditions, dispersing most of the emissions to farther regions which then get scavenged via dry and wet deposition or chemical transformation in the atmosphere (Guttikunda and Gurjar, 2012). The changes in air quality observed during the lockdowns are therefore due to a combination of these seasonal effects and the curtailment of activities. This paper does not make a claim on the improvements in air quality attributed solely to the lockdowns. Across Indian cities, a 20%-60% reduction was witnessed in all the lockdown periods for PM2.5, PM10, SO2, and NO2 and 10%-60% increase in daytime O3 concentrations.
The first lockdown period overlapped with open forest fires over the Deccan Plateau. These are seasonal fires enhanced due to dry weather, present of dense shrubs, and higher surface temperatures. This led to higher than average PM2.5 concentrations over Central India compared to the pre-lockdown period (Figures 6-9).
Most cities demonstrated a reduction in the NO2 concentrations. Vehicle exhaust is the main source for NO2 emissions, and nearly 95% of the passenger transport was shut and nearly 50% of the heavy freight movement (https://tinyurl.com/y4nutm5v) blocked on the highways. Latest OMI NO2 satellite imagery, comparing 2017-2019 to 2020 (https://tinyurl.com/y4tqw993) showed a drop in the overall NO2 emissions for March 25-April 25. The areas with coal-fired power plants and heavy industry in Madhya Pradesh, Chhattisgarh, Uttar Pradesh, and Bihar continued to show relatively higher values.
PM2.5 concentrations dropped across the country at the start of the lockdown period and with every phase there is a marked increase in the averages. This pollutant is affected by all the known sources and all the regulations discussed above led to these drops. A climatological analysis of the satellite retrieval based AOD estimated a 50% drop at the start of the lockdowns, with levels slowing catching up to the decadal averages by the end of the fourth lockdown (https://tinyurl.com/yylozx88). On average across India, every lockdown period witnessed at least a 25% reduction, mostly coming from the cities.
In India, road dust and dust from the construction activities are major contributors to PM10 pollution. With most traffic off the roads and all construction activities banned, PM10 experienced a drop of 28%, 27%, and 22% in the first three lockdowns. By the end of the 4th lockdown, overall PM10 levels rose. This is partly due to a phased increase in the traffic and onset of minor dust storms in the West.
SO2 pollution levels did not show dramatic drops like those witnessed with PM2.5 and NO2. Since most of the heavy industry relying on coal, like the coal-fired power plants, coal mining, iron and steel, and fertilizer, were operating at reduced levels, SO2 pollution levels remained largely unaffected throughout the period. First two periods witnessed a 10% drop and the last two saw no change in average concentrations compared to the pre-lockdown weeks.
CO pollution levels followed a similar pattern to SO2. In addition, we estimated a drop also coming from the cooking activities in the cities, with the migration of most of the low-income groups, and uncertainty following the announcement of the first lockdown. Biomass burning for cooking is a major contributor to CO emissions. On average, all the time periods witnessed at least a 15% drop.
Of the six pollutants, Ozone (O3) is the most peculiar one and the most dependent on the mix of the emissions available for its production and destruction in the urban and rural settings. Most of the Tier 1 and Tier 2 cities witnessed an increase in the daytime average concentrations and some drops in the background rural areas. On average across India, the daytime average concentrations rose 6%, 7%, 25%, and 16% in the four lockdown periods. While there is a seasonality associated with the rise in O3 concentrations, with the change from winter to spring, a portion of this increase can be linked to chemistry due and absence of NOx and hydrocarbon emissions. The photochemistry in urban and rural areas is critical and also an understudied subject in India’s air quality (WIRE, 2020).
3.2 City specific observations
Data from 122 cities with at least one continuous monitoring station are available and were analysed in this study. This section outlines some additional notes on the observed trends. In cities like Ahmedabad, Bengaluru, Chennai, Delhi, Ghaziabad, Gurugram, Hyderabad, Kanpur, Kolkata, Lucknow, and Noida, pollution before and during the lockdowns displayed expected downward trends. The importance of vehicle exhaust, road dust, construction dust, small industries, cooking, and open waste burning is evident in the overall drop in the primary pollutant levels. These observations build on the Air Pollution knowledge and Analysis (APnA) database (Table 3) (Guttikunda et al., 2019).

Agra showed the largest increase in daytime O3 concentrations during the lockdowns. While the reduction in NOx emissions and resultant chemistry are likely to be the reason, the geographical location of the city and its emission source mix play an important role as well. To control damage to the Taj Mahal, the city implemented regulations to cut vehicle exhaust and industrial sources in the immediate vicinity. Despite these efforts, pollution levels remain in the non-attainment range, largely because of the influence of pollution from the neighboring cities in the Indo-Gangetic plain. 30% of Agra’s PM2.5 pollution on an annual basis is regional in nature. With a systematic reduction in emissions across the region and in the city, while other pollutants saw a reduction, O3 witnessed a ~six-fold increase.
Delhi has the maximum number of operational monitoring stations (38) among Indian cities. Delhi’s monitoring data also allow analysis of long-term trends. As Figure 10 shows, average PM2.5 concentrations for the months of March and April ranged from 100 to 140 microgram/m3 during the 10 years from 2010 to 2019. During the lockdown periods, PM2.5 concentrations ranged 40 to 65 microgram/m3. This translates to a climatological reduction in the air pollution levels in the range of 35%-72% depending on the time and station under consideration. Other pollutants PM10, NO2, SO2, and CO also witnessed substantial drops during the lockdown periods, with all them showing an increasing trend between the first and the last period, indicating easing of the restrictions, especially for the transport sector. Daytime O3 pollution were higher than normal in all the periods, indicating a new chemical balance due to redcued emission rates of NOx and hydrocarbons and due to similar changes in the overall emission mix in the region.
Figure 10: Summary of continuous ambient PM2.5 concentrations from all the stations in NCT Delhi between 2010 and 2019

Mumbai plays a central role in India’s economy and accounts for 25% of industrial output, 70% of maritime trade, and 70% of capital transactions of the country. The Greater Mumbai region includes Navi Mumbai and Thane. Impact of all traffic shut in the region was immediate and was reflected in the largest drop in the NO2 concentrations (80%) in all the lockdown periods. All the pollutants, including O3, demonstrated drops of lesser relative magnitude, except for SO2. This is puzzling given that there were no industrial activities and no on-road traffic, and reduced power plant operations in the city. A likely explanation for this jump came from a satellite image from the Sentinel series showing four clusters of big and small ships hovering off the coast of Mumbai (https://tinyurl.com/y663nb4r). These clusters were likely waiting for the lockdown restrictions to ease and allow for unloading and loading of the goods. This needs further investigation. If this hypothesis is proven true, this finding emphasizes the significant role of an often-ignored source in port cities like Mumbai.
Figure 11: Cluster of boats near Mumbai port photographed by Sentinel-2 satellite (Source: https://tinyurl.com/y663nb4r )

Kolkata is the cultural and commercial centre of East India, dominated by textiles. The twin cities of Kolkata and Howrah, like Mumbai, witnessed 60% reduction in the PM2.5, NO2, and SO2 levels; 30% drop in CO; and a 5%-10% increase in the O3 concentrations.
Bengaluru meets the national ambient air quality standards throughout the year. This is partly due to its location on the Deccan Plateau, favoured by good winds from the west and the east, with occasional rains. The most dominant sources of pollution in the city are vehicle exhaust, road dust, and construction dust, and with all three shut, overall reductions ranged 30%-50% for all the pollutants. Ten cities in Karnataka, except for Bengaluru witnessed changes attributable to the regional contributions, in addition to the drops in the emissions from activities within the cities (which is the most in all the cities across India).
Aizawl in Mizoram, Shillong in Meghalaya, and Guwahati in Assam are the only three cities in Northeast India with continuous monitoring stations. Reductions in pollution levels ranged from 30%-60%. Guwahati’s southern corridor towards Shillong is a busy commercial area which has spawned much residential and commercial development (like tea manufacturing) and the eastern corridor connects the city to the refinery. All the sectors were affected by the lockdown restrictions. With the refinery operating at lower capacity and vehicle exhaust absent, Guwahati’s daytime O3 pollution levels doubled through the periods.
In Rajasthan, the cities of Ajmer, Alwar, Bhiwadi, Jaipur, Jodhpur, Kota, Pali, and Udaipur have continuous monitoring. Because of dry landcover, PM10 levels are typically higher than the rest of the country and dominated by dust. O3 pollution levels are also typically higher in this state because of more sunlight. All the cities showed a decrease in pollution levels, with all the commercial, industrial, and transport activities shut.
In Punjab, Ambala, Amritsar, Bathinda, Jalandhar, Khanna, Ludhiana, Mandi Gobindgarh, Panchkula, Patiala, and Rupnagar have monitoring stations. Amritsar because of the Golden Temple has, like Agra, implemented control measures to minimize damange to the Temple and so most of the air quality improvements are a result of changes in the region. Ambala’s major source of pollution is traffic from the grand-trunk road, like Karnal and Panipat (in Haryana). With all freight movement blocked, NO2 pollution showed the biggest and immediate drop. Coal-fired power plants near Bathinda, Mandi, and Rupnagar, with continued operations, limited the overall reductions possible in air pollution levels. Rupnagar, Ludhiana, and Panchkula displayed continuous increase in the pollution levels moving between first and fourth lockdown periods.
Talcher (Odisha) hosts many power plants and a cluster of coal mining blocks, all of which were operational through the lockdown periods. Unlike Tier 1 and Tier 2 cities, air pollution levels here either remained unchanged or increased during the lockdown periods. SO2 is the only pollutant to show a reduction, which is likely due to a decrease in the coal combustion related activities in the region. These trends were similar in other coal producing areas like Singrauli and Chandrapur in Maharashtra.
4. Air quality lessons from COVID times
The most important lesson from this forced lockdown “natural experiment” is that “clean air” and reaching national ambient standards for all the criteria pollutants are possible to achieve. In the past, for the non-attainment cities, PM2.5 daily standard were achieved during rainy days or occasionally with the help of some winds.
The two-month period of lockdowns, with the restrictions at the fullest in the first phase and little relaxed in the fourth, demonstrated to the public that the only way to achieve “clean air” is by cutting emissions at the source. Of course, cutting emissions at the source need not come at the social and economic costs observed during the lockdown (Sengupta and Jha, 2020) - there are other, more sustainable ways to accomplish the same result. However, there are no short-cuts or silver-bullets available, and we must cut emissions for all the sources in order to sustain air quality improvements over time.
A city centric approach is not enough. We must adopt an airshed approach where the reductions in the city are complemented with similar reductions in the region to reach and sustain the national ambient standards. (Guttikunda et al., 2019) explains this approach in the Air Pollution knowledge Analysis (APnA) city program application for 20 airsheds, which was extended to 50 airsheds covering 60 cities. The study established a baseline emissions inventory for every city at 1-km resolution and for all India at 25-km resolution, using a database compiled from statistics, energy, industrial and environmental department (UEinfo, 2020). Combined with local and regional meteorological data and CAMx chemical transport modelling system, this study evaluated the contributions of different sources inside and outside the cities.
For cities in Punjab like Amritsar, Ludhiana, Patiala and Chandigarh, outside contribution is more than 50%. For cities like Chennai, with the sea on one side and mostly agricultural activities on the other, this share is 15%. On average, 30% of the observed PM2.5 pollution in the 60 cities is regional in nature, originating outside the city limits.
Where there is a large contribution from outside the city boundaries, regional (including sometimes inter-state) collaboration are needed to achieve clean air. Delhi and Mumbai are classic examples of big cities with many satellite settlements. While Mumbai enjoys the luxury of most of its influential regions in the same state, Delhi needs a strong regional coordination with Haryana, Punjab, Uttar Pradesh, and Rajasthan.
Furthermore, while our analysis here, reliant as it is on the presence of monitoring stations, is restricted to cities, we must remember that significant parts of rural India are also polluted.
The key sectors that contribute to the problem and must fully be addressed are as follows.
Vehicle exhaust – with the introduction of the BS6 fuel and vehicle standards, we need to focus on the behavioural change in mobility by promoting the use of public transport and non-motorized transport.
Road and construction dust – we need strict enforcement of current guidelines for maintaining roads and construction sites.
Industries – while promoting the use of clean energy sources (like solar and wind) and energy efficiency protocols across the sectors, we need strict (and immediate) enforcement of the current environmental standards.
Household cooking and heating – while the PMUY program has enhanced the capacity to issue new connections across rural India, we need more awareness of the need to use clean energy (including electricity) for cooking and heating, and increase both the demand for and supply of clean energy.
Open waste burning continues to be a menace in most of the cities in India.
References
Balakrishnan, K., Dey, S., Gupta, T., Dhaliwal, R.S., Brauer, M., Cohen, A.J., Stanaway, J.D., Beig, G., Joshi, T.K., Aggarwal, A.N., Sabde, Y., Sadhu, H., Frostad, J., Causey, K., Godwin, W., Shukla, D.K., Kumar, G.A., Varghese, C.M., Muraleedharan, P., Agrawal, A., Anjana, R.M., Bhansali, A., Bhardwaj, D., Burkart, K., Cercy, K., Chakma, J.K., Chowdhury, S., Christopher, D.J., Dutta, E., Furtado, M., Ghosh, S., Ghoshal, A.G., Glenn, S.D., Guleria, R., Gupta, R., Jeemon, P., Kant, R., Kant, S., Kaur, T., Koul, P.A., Krish, V., Krishna, B., Larson, S.L., Madhipatla, K., Mahesh, P.A., Mohan, V., Mukhopadhyay, S., Mutreja, P., Naik, N., Nair, S., Nguyen, G., Odell, C.M., Pandian, J.D., Prabhakaran, D., Prabhakaran, P., Roy, A., Salvi, S., Sambandam, S., Saraf, D., Sharma, M., Shrivastava, A., Singh, V., Tandon, N., Thomas, N.J., Torre, A., Xavier, D., Yadav, G., Singh, S., Shekhar, C., Vos, T., Dandona, R., Reddy, K.S., Lim, S.S., Murray, C.J.L., Venkatesh, S., Dandona, L., 2019. The impact of air pollution on deaths, disease burden, and life expectancy across the states of India: the Global Burden of Disease Study 2017. The Lancet Planetary Health 3, e26-e39.
Brauer, M., Guttikunda, S.K., K A, N., Dey, S., Tripathi, S.N., Weagle, C., Martin, R.V., 2019. Examination of monitoring approaches for ambient air pollution: A case study for India. Atmospheric Environment 216, 116940.
Chowdhury, S., Dey, S., Guttikunda, S., Pillarisetti, A., Smith, K.R., Di Girolamo, L., 2019. Indian annual ambient air quality standard is achievable by completely mitigating emissions from household sources. Proceedings of the National Academy of Sciences 116, 10711-10716.
CPCB, 2011. Air Quality Monitoring, Emission Inventory and Source Apportionment Study for Indian cities. Central Pollution Control Board, Government of India, New Delhi, India.
CPCB, 2020. Continuous Ambient Air Quality Monitoring System, in: Board, C.P.C. (Ed.). Ministry of Environmental Forests and Climate Change, The Government of India.
Ganguly, T., Kurinji, L.S., Guttikunda, S., K., 2020. How robust are urban India’s clean air plans? An assessment of 102 plans. Council on Energy, Environment and Water, New Delhi, India.
GBD-MAPS, 2018. Global Burden of Disease - Mapping Air Pollution Sources in India, Special Report 21. Health Effects Institute, Boston USA.
GBD, 2019. Global Burden of Disease, in: Institute of Health Metrics Evaluation, U.o.W., Washington, USA (Ed.).
Goel, R., Guttikunda, S.K., 2015. Evolution of on-road vehicle exhaust emissions in Delhi. Atmospheric Environment 105, 78-90.
Guttikunda, S., Gurjar, B., 2012. Role of meteorology in seasonality of air pollution in megacity Delhi, India. Environmental Monitoring and Assessment 184, 3199-3211.
Guttikunda, S., Jawahar, P., Goenka, D., 2015. Regulating air pollution from coal-fired power plants in India. Economic and Political Weekly 50, 62-67.
Guttikunda, S.K., Goel, R., 2013. Health impacts of particulate pollution in a megacity—Delhi, India. Environmental Development 6, 8-20.
Guttikunda, S.K., Goel, R., Pant, P., 2014. Nature of air pollution, emission sources, and management in the Indian cities. Atmospheric Environment 95, 501-510.
Guttikunda, S.K., Jawahar, P., 2012. Application of SIM-air modeling tools to assess air quality in Indian cities. Atmospheric Environment 62, 551-561.
Guttikunda, S.K., Mohan, D., 2014. Re-fueling road transport for better air quality in India. Energy Policy 68, 556-561.
Guttikunda, S.K., Nishadh, K.A., Jawahar, P., 2019. Air pollution knowledge assessments (APnA) for 20 Indian cities. Urban Climate 27, 124-141.
IQair, 2019. World's most polluted cities in 2019, in: Institute of Health Metrics Evaluation, U.o.W., Washington, USA (Ed.).
Pandey, A., Sadavarte, P., Rao, A.B., Venkataraman, C., 2014. Trends in multi-pollutant emissions from a technology-linked inventory for India: II. Residential, agricultural and informal industry sectors. Atmospheric Environment 99, 341-352.
Pant, P., Lal, R.M., Guttikunda, S.K., Russell, A.G., Nagpure, A.S., Ramaswami, A., Peltier, R.E., 2019. Monitoring particulate matter in India: recent trends and future outlook. Air Quality, Atmosphere & Health 12, 45-58.
Sadavarte, P., Venkataraman, C., 2014. Trends in multi-pollutant emissions from a technology-linked inventory for India: I. Industry and transport sectors. Atmospheric Environment 99, 353-364.
Sengupta, S., Jha, M.K., 2020. Social Policy, COVID-19 and Impoverished Migrants: Challenges and Prospects in Locked Down India. The International Journal of Community and Social Development, 2516602620933715.
UEinfo, 2020. Resource Links: Energy, Emissions and Air Pollution Analysis in India. https://www.urbanemissions.info.
Van Donkelaar, A., Martin, R.V., Brauer, M., Hsu, N.C., Kahn, R.A., Levy, R.C., Lyapustin, A., Sayer, A.M., Winker, D.M., 2016. Global Estimates of Fine Particulate Matter using a Combined Geophysical-Statistical Method with Information from Satellites, Models, and Monitors. Environmental Science and Technology 50, 3762-3772.
van Donkelaar, A., Martin, R.V., Li, C., Burnett, R.T., 2019. Regional Estimates of Chemical Composition of Fine Particulate Matter Using a Combined Geoscience-Statistical Method with Information from Satellites, Models, and Monitors. Environmental Science & Technology 53, 2595-2611.
Venkataraman, C., Brauer, M., Tibrewal, K., Sadavarte, P., Ma, Q., Cohen, A., Chaliyakunnel, S., Frostad, J., Klimont, Z., Martin, R.V., Millet, D.B., Philip, S., Walker, K., Wang, S., 2018. Source influence on emission pathways and ambient PM2.5 pollution over India (2015-2050). Atmospheric Chemistry and Physics 18, 8017-8039.
Venkataraman, C., Ghosh, S., Kandlikar, M., 2016. Breaking out of the box: India and climate action on short-lived climate pollutants. Environmental Science and Technology 50, 12527-12529.
WIRE, 2017. It's About Time We Got Smarter About Monitoring Our Air Pollution. https://science.thewire.in.
WIRE, 2018. The Draft National Clean Air Programme Is Spirited but Lacks Action Points. https://science.thewire.in.
WIRE, 2020. India: Why Was Daytime Ozone Pollution Higher During the Lockdowns? https://science.thewire.in.
Appendix
Tables A1-A5 below showing average ambient pollution levels for five pollutants before and during the lockdown phases across Indian cities. (Navigate left-right using the arrows or the thumbnails at the bottom)
Figures A1-A3 below visualising pollution levels in this period for Kolkata, Bengaluru and Aizawl. (Navigate left-right using the arrows or the thumbnails at the bottom)